SamurAI Portal User Guide
Overview and guides for each feature within the portal
The SamurAI platform is a vendor-agnostic, cloud native, scalable, API-driven, advanced threat detection, and response platform. The platform is used to deliver the Managed Detection and Response (MDR) service.
What is the SamurAI Portal?
The SamurAI Portal is a centralized web-based application that provides users with access to a variety of features, information and tools - it is essentially your visibility into the Managed Detection and Response service, examples features include:
- self service capabilities to manage and monitor telemetry integrations
- query your data ingested into the SamurAI platform
- view alerts generating by the SamurAI platform and integrated products
- view, update and track security incidents reported to your organization
- submit tickets to the SamurAI Security Operation Center (SOC)
- reporting and summary information on various aspects of the service
Which web browsers are supported?
The SamurAI Portal supports all major browsers, including Chrome, Firefox, Edge and Safari.
Who uses the SamurAI Portal?
Different teams or individuals may use the portal based on their specific areas of responsibility, but generally anyone within your organization that requires service visibility and/or to configure aspects of the service.
Why use the SamurAI Portal?
The SamurAI Portal provides self service capabilities, e.g the ability to configure and download Local Collector(s) which may be required for you to integrate your telemetry data sources and/or add additional users. Once you have integrated your telemetry sources you can review general service metrics and start to query your data. Importantly for the MDR service, the SamurAI Portal also provides access to Security Incidents and the ability to raise tickets as required. Please review useful links below covering various features:
How do I get help?
Review our Getting Help guide for information. You may also wish to review our Support Policy.
What’s next?
If you have not already done so, the first place to start is by integrating your products with the SamurAI platform - this may require you to deploy local collector(s). Review SamurAI Collectors to understand more.
1 - Security Incidents
Security Incidents represent actionable security concerns or threat(s) identified as a result of an investigation by our SOC analysts. The Security Incident contains information about the threat(s) and how best to mitigate or minimize the risk.
Security Incidents are reported to you following our Incident Management process and are associated with tickets within the SamurAI Portal and downloadable in PDF format if desired.
Security Incident Notification
As per the Managed Detection and Response Service Description, notifications are provided by telephone or email based on severity:
- Critical severity: Phone / E-mail notifications.
- Low, Medium, High severity: E-mail notifications.
Information capture for notifications are completed during the MDR on-boarding process, however you can update contact details or telephone numbers by raising a ticket, during Threat Reviews and contact with your Cybersecurity Advisor (CSA).
Viewing Security Incidents
To access Security Incidents, click on  Security Incidents from the main menu.
A visual indicator is displayed beside the Security Incidents menu item displaying the total number of Security Incidents that require your attention and are awaiting your response/action.

Figure 1: Example Security Incidents
Security Incident Dashboard

Figure 2: Example dashboard
The Security Incidents dashboard panel displays summary information as:
- Awaiting feedback: Security Incidents awaiting your feedback and/or action
- Awaiting SOC: Security Incidents awaiting response from the SOC
- Closed: all closed Security Incidents
- Total: Total Security Incidents
Security Incident Fields
Find information related to all Security Incident fields (outlined red in Figure 1):
1. Reference
- Reference number of the Security Incident.
2. Severity
- All Security Incidents are categorized with a severity that describes the reported threat.
| Severity | Description |
|---|
| Critical | Security Incidents with severe impact that threatens to have a significant adverse impact on the affected systems. These issues have a high probability of spreading or propagating, pose a threat to confidential or otherwise sensitive data or system. Critical security incidents require immediate attention for remediation or mitigation. |
| High | Security incidents where if exploited, these threats could lead to compromise of the system and/or loss of information. Should be investigated in a timely fashion. |
| Medium | Minor security incidents with low risk of spreading or propagation. Should be tracked and followed-up but generally medium threat severity incidents require no immediate action. |
| Low | Observed security related event that could be an indicator of threat or interesting from other perspectives but no direct security incident or threat. |
- The Security Analyst will make an informed decision in assigning the threat severity taking into consideration the specific situation and past experience.
- The assigned severity level will provide you an easy means to quickly assess how important a threat is, and the level of priority which should be assigned in addressing it. This will allow you to re-prioritize your actions so that you can start mitigating any threats quickly.
3. State
- Each Security Incident has an assigned state which quickly allows you to determine who is responsible for follow up.
| State | Description |
|---|
| Awaiting Feedback | Security Incident has been created or updated and is awaiting your feedback / response |
| Awaiting SOC | Security Incident is currently awaiting feedback / input from the SOC. |
| Closed | The Security Incident is Closed |
4. Title
- A “one-liner” that describes the content of the reported Security Incident. This field is used when listing tickets and within notifications.
5. MITRE ATT&CK
- To make it easier to understand the threat and perform additional mitigations actions, we categorize a threat according to tactics in the MITRE ATT&CK IT and OT framework.
A threat can be categorized with multiple MITRE tactics.
For more details about MITRE ATT&CK tactics:
Reflecting the MITRE tactics, provides the possibility to use MITRE techniques to do additional threat hunting and mitigation.
6. Revision
- If a threat changes, emerges or new relevant info is available, a new revision of the Security Incident will be created. The revision number is reflected in this field.
7. Created
- Date and time of creation of the Security Incident in the format [yyyy:mm:dd], [hh:mm:ss] with time represented in Universal Time Coordinated (UTC).
8. Updated:
- Date and time of last update to the Security Incident in the format [yyyy:mm:dd], [hh:mm:ss] with time represented in Universal Time Coordinated (UTC).
You can filter and sort on any of the available fields as well as disable and enable for your desired view. You can also export the list to CSV for download.
The search function will search within all incident details including comments and evidence.
What now?
Click on a Security Incident to view more detail and work directly with our SOC within the Situation Room.
1.1 - The Situation Room
We adopted the term ‘Situation Room’, often used by military and political establishments as an intelligence management center to monitor and deal with crisis situations.
The SamurAI MDR Situation Room is where you will find detailed information for any given Security Incident reported to you and allows you to communicate with our SOC Analysts.
Enter The Situation Room
To enter the Situation Room, click a Security Incident reported to you from the Security Incident List.

Figure 1: Example Situation Room
The Situation Room is structured as follows, click on the links to learn more:

Figure 2: Example incident information
To the left of the window, high level information about the Security Incident will be displayed, some of which is also summarized under the all Security Incidents menu. For clarity we have also included the field information below:
1. Incident Reference # / Title
- Reference number of the Security Incident
- A “one-liner” that describes the content of the reported Security Incident.
Any actions that the SOC have taken will be shown below the reference number and title e.g host isolation
2. Severity
- All Security Incidents are categorized with a severity that describes the reported threat.
| Severity | Description |
|---|
| Critical | Security Incidents with severe impact that threatens to have a significant adverse impact on the affected systems. These issues have a high probability of spreading or propagating, pose a threat to confidential or otherwise sensitive data or system. Critical security incidents require immediate attention for remediation or mitigation. |
| High | Security incidents where if exploited, these threats could lead to compromise of the system and/or loss of information. Should be investigated in a timely fashion. |
| Medium | Minor security incidents with low risk of spreading or propagation. Should be tracked and followed-up but generally medium threat severity incidents require no immediate action. |
| Low | Observed security related event that could be an indicator of threat or interesting from other perspectives but no direct security incident or threat. |
3. Status
- Each Security Incident has an assigned status which quickly allows you to determine who is responsible for follow up.
| State | Icon | Description |
|---|
| Awaiting Feedback |  | Security Incident has been created or updated and is awaiting your feedback / response |
| Awaiting SOC |  | Security Incident is currently awaiting feedback / input from the SOC. |
| Closed |  | The Security Incident is Closed. |
4. Created
- Date and time of creation of the Security Incident in the format [yyyy:mm:dd], [hh:mm:ss] with time represented in Universal Time Coordinated (UTC) by default.
5. Updated
- Date and time of update to Security Incident in the format [yyyy:mm:dd], [hh:mm:ss] with time represented in Universal Time Coordinated (UTC) by default. This may indicate multiple revisions of the Security Incident.
6. MITRE Categories
- To make it easier to understand the threat and perform additional mitigation actions, we categorize a threat according to tactics in the MITRE ATT&CK IT and OT framework.
A threat can be categorized under multiple MITRE tactics.
For more details about MITRE ATT&CK tactics:
Reflecting the MITRE tactics, provides the possibility to use MITRE techniques to conduct additional threat hunting, respond and mitigate threats.
Towards the top of the window additional information is displayed:

Figure 3: Additional information
7. Revision
- If a threat changes, emerges or new relevant information is available, a new revision of the Security Incident will be created and the revision number displayed. e.g Revision 2,3,4.
- You are notified of any new revisions (which is also displayed within the Communication Channel) with the latest revision being displayed as default.
- Selecting the drop down allows you to select the revision number which will update details and evidence appropriately.
8. PDF
- Allows you to download the Security Incident and all details in PDF format.
9. Close Incident
- Allows you to Close the Security Incident.
10. Status
- Icon depiction of the current Security Incident Status. See item (3).
Details
Security Incident details are included within this section as:
Summary
A short summary of the Security Incident.
Description
In this section, the SOC clearly describes the relevant threat and outlines why this poses a risk. The description includes steps and findings through the analysis process where the SOC has used enrichment data and performed Threat Hunting and correlation. The SOC will add Evidence data to support the findings.
The Incident Description can be short or extensive depending on the what is needed to accurately describe the reported threat and associated risk.
Recommendations
A set of actionable mitigation step(s) that can be performed by you to mitigate the threat and bring it to closure. This may include signatures that we recommend to block.
The Recommendations might not be the only way to mitigate the threat. Rather, they provide a suggested approach from the SOC. Ultimately, the choice of the most appropriate mitigation approach rests with the client. When performing mitigation, it is also necessary to understand risks associated with mitigation actions, as there could be impacts on availability and in some cases even data loss could occur. These kinds of impacts may either be known side-effects of mitigation or there may be potential risks associated with errors which could occur during mitigation.
Hosts
Specific hosts applicable to the Security Incident are listed in the table with details which may include IP Address, Hostname, User, Endpoint ID and any actions taken by the SOC e.g if the SOC has isolated an endpoint.
Communication Channel
The Communications Channel provides messaging functionality allowing you to communicate with SOC Analysts in real-time. The editor allows you to construct and format text as desired, your messages are displayed to the left of the Communications Channel whilst all SOC messages are displayed to the right.
Emoji support is also available.
- Windows: Press Windows + . (period) to open the emoji picker.
- macOS: Press Control + Command + Space to open the emoji and symbol picker.

Figure 4: Communications channel
After typing your message ensure to click on
 Send Message
Evidence
Evidence is provided with any given Security Incident to corroborate a SOC analyst investigation and ultimately the Security Incident.
Evidence may be included by the SOC analysts or by a user and will display a timestamp of when it was added building a timeline. Evidence may include:
- Alert data - vendor/product alerts and/or SamurAI platform alerts
- Log data- log data
- Files - e.g PCAP files if available
You can also upload supporting evidence for the security incident, click on Upload File and provide a description (optional) and select the file to upload. The maximum size limit for the file is 50MB.
Selecting the drop down  allows you to view or download the Evidence. For Log data you can pivot to Advanced Query by clicking the link to view the log data and complete further investigation as required.
Indicators
If any Indicators of Compromise (IoC) have been identified applicable to the Security Incident, they will be listed in the table. Indicator types may include (but are not limited to):
- Domain
- IPv4 address
- IPv6 address
- IPv4 address with port
- IPv6 address with port
- MD5
- SHA1
- SHA256
- Email
- URL
At the SOC Analyst discretion, they may perform actions based on high confidence IoCs. This may include (based on the type of IoC):
- Add to Dynamic Block List with the intention for any technology subscribed to block the IoC.
- Perform an automated retroactive hunt leveraging the SamurAI Hunting Engine. This automated search is against the last 30 days of data stored within the SamurAI platform. Any findings may result in a new Security Incident.
- Perform a manual retroactive search in certain cases which fall outside of automated scope.
Change History
If there are multiple revisions of the Security Incident, a change history will be displayed providing full visibility into each change.
What Now?
Please refer to our Incident Management process as it is important you understand what is expected of you in the result of a Security Incident as well as our responsibilities.
2 - Threat Review
What is a Threat Review?
A Threat Review is a meeting between SamurAI Security Operation Center (SOC) Analysts your assigned Cybersecurity Advisor (if applicable) and your designates with the goal of ensuring your organization derives maximum value from the SamurAI Managed Detection and Response (MDR) service.
Threat Reviews include:
- review of any reported security incidents within the time period
- recommendations to improve detection and response
- follow-up and tracking to ensure reported threats are handled and mitigated
- dialogue around detection and emerging threats
How often are Threat Reviews conducted?
Threat Reviews are conducted quarterly with a standard SamurAI MDR subscription and are typically scheduled during onboarding.
For clients’ that prefer a dedicated senior-level resource and a monthly candence of Threat Reviews the SamurAI Cybersecurity Advisor is available as an add-on subscription.
Review MDR Threat Reviews and/or SamurAI Cybersecurity Advisor Service Description.
Threat Reviews and the SamurAI Portal
Threat Review information is available within the SamurAI Portal after being published by the SOC. Publication of a new Threat Review will typically occur 24hrs before the scheduled meeting.
To access Threat Reviews, click on  Threat Review from the main menu.
A visual indicator is displayed beside the Threat Review menu item displaying the number of published Threat Reviews that may require your review.
The Threat Review landing page displays all Threat Reviews to date for your SamurAI MDR subscription and also documented Action Points.

Figure 1: Example Threat Reviews
Threat Review Fields
Find information related to Threat Review fields:
1. Reference
- Reference number of the Threat Review
2. Status
3. Title
- A given title for the Threat Review typically based on the time period.
4. Start Date
- Start date for all detail within the Threat Review.
5. End date
- End date for all detail within the Threat Review.
Action Points
Action Points are typically tasks that have been documented during a Threat Review. Actions points are tracked over the subcription period and once actioned updated as Completed.

Figure 2: Example Action Points
What now?
Click on a Threat Review listed within the landing page to view more detail. Review Threat Review Detail for additional information.
2.1 - Threat Review Detail
Information and detail of a Threat Review are presented within the SamurAI Portal. In this article we walk through elements of each Threat Review.
Summary
Summary information of the Threat Review including status, start and end date. These dates will align with you SamurAI MDR subscription (i.e quarterly or monthly) please review How often are Threat Reviews conducted?

Figure 1: Example Summary data
Metrics
Hover over any area of each chart for additional information.
For the given Threat Review period, various widgets will be displayed providing you insight to the service. This includes:
Monitoring, Detection & Response Summary
The funnel summarizes:
- telemetry ingested (events) by the SamurAI platform from your configured integrations
- the security detections (alerts) made by the SamurAI platform detection engines and third party vendors which are triaged and investigated by the SamurAI SOC
- the number of security incidents reported to your organization
The funnel infers the value of the service based on the data analyzed focusing on detecting and reporting threats to your organization.

Figure 2: Example Monitoring, Detection & Response summary for the period
You can also find information within a specified time-frame within the
Alerts Dashboard.
Licence usage
Two charts display your utilized data quota (in Gigabytes GB) against your data subscription (an aggregated quota typically based on number of endpoints subscribed). Any overages or under utilization is discussed with you during the Threat Review meeting.
Licence usage charts may not be included if your subscription is not based on number of endpoints.

Figure 3: Example Licence usage for the period
Alerts
A donut chart showing the alerts per detection method over the Threat Review period. For a brief explanation of the detection engines please refer to Alerts

Figure 4: Example Alerts per detection method chart
Security Incidents
A chart depicting security incidents reported by severity within the Threat Review period.

Figure 5: Example Security incidents per severity chart
Security Incidents
New Security Incidents
Presented in the table are all Security Incidents reported during the Threat Review period.
Click on a Security Incident and you are redirected you to the Situation Room relevant to the Security Incident. Refer to The Situation Room for additional information.

Figure 6: Example New security incidents table
Highlighted Security Incidents
Any Security Incidents that the SOC determine require attention and discussion during the Threat Review meeting will be included here in table format.
General Tickets
Presented in the table are all general tickets which were created within the Threat Review period.
Click on a General Ticket and you are redirected to the ticket details. Refer to Getting Help for additional information.
New General tickets

Figure 7: Example New general tickets table
Highlighted general tickets
Any General Tickets that the SOC determine require attention and discussion during the Threat Review will be included here in table format.
Threat Intel
The SOC may include Threat Intelligence with references for the Threat Review reporting period.
Other
Any other topics outside of a standard Threat Review are displayed here, for example a client working with a dedicated Cybersecurity Advisor (CSA) with specific requests may be documented here.
Action Points
A list of current Action Points based on all Threat Review, for example recommendation that have been made which may require your action.
Figure 8: Example Action points table
3 - Dashboard
3.1 - Telemetry Dashboard
The Telemetry dashboard provides a simple self explanatory high level view of your Managed Detection and Response service telemetry metrics.
Summary Panels
Within the dashboard are various summary panels which can be updated based on a specified time period and includes:
- Total number of events ingested into the SamurAI platform
- Total log volume
- Number of integrations (this is current state and not affected by the specified time period)
- Unhealthy integrations (these integrations likely need action, please review the Telemetry Monitoring article for further information)
The dashboard panel uses aggregated data and may not be completely up to date with the latest events.

Figure 1: Example summary panel
Time period
You can update relevant panels to specific date and time ranges. We have included Quick time ranges or you can specify a date and time period.

Figure 2: Date and time selection
Detail Panels
Additional panels provide event data based on products you have integrated with the SamurAI platform.
Hover over any area of the bar or chart for specific time period and total events
Events per product

Figure 3: Example events per product bar graph
Events per product

Figure 4: Example events per product pie chart
Data ingested per product

Figure 5: Example data ingested per product table
If you wish to drill down into the events we recommend you use the Advanced Query feature. Review Advanced Query Introduction for more information.
3.2 - Alerts Dashboard
The alerts dashboard provides valuable insights into your organization’s security landscape, despite all alerts being handled by the SamurAI Security Operation Center (SOC) it provides visibility into the volume of alerts which potentially lead to validated threats and reported to you as a security incident.
Additionally we provide transparency by categorizing the alerts by detection engine and highlighting top threat signatures, whilst you do not need to act upon these alerts, this information demonstrates the SamurAI MDR service’s scale and effectiveness.
Outlined below are examples and an explanation of each panel within the dashboard:
Select the time period to adjust all panels in the dashboard, note the results can provide upto the last 12 months of alert data. Hover over any area of a bar or chart for specific time period and totals.
Monitoring, Detection and Response summary
The funnel outlines telemetry ingested (events) by the SamurAI platform from your configured integrations, the security detections (alerts) made by the SamurAI platform detection engines and third party vendors which are triaged and investigated by the SamurAI SOC, and the number of security incidents reported to your organization. The funnel infers the value of the service based on the data analyzed focusing on detecting and reporting threats to your organization.

Figure 1: Example summary
Number of alerts
The total number of alerts analyzed by the SamurAI platform and SOC analysts.

Figure 2: Example number of alerts
Number of unique signatures
The total number of unique alert signatures.

Figure 3: Example unique signatures
Alerts per detection method
Donut chart showing the alerts per detection method. For a brief explanation of the detection engines please refer to Alerts.

Figure 4: Example alerts per detection method chart
Alerts timeline per detection method
Bar graph showing alerts over the time period per detection method.

Figure 5: Example alerts timeline per detection method graph
Top 10 signatures
Top 10 alert signatures from all detection methods.

Figure 6: Example top 10 signatures
Top 10 signatures for Hunting Engine
Top 10 alert signatures for the SamurAI hunting engine.

Figure 7: Example top 10 signatures for hunting engine
Top 10 signatures for Real-time Engine
Top 10 alert signatures for the SamurAI real-time engine.

Figure 8: Example top 10 signatures for real-time engine
Top 10 signatures for vendor
Top 10 alert signatures from your vendor product integrations.

Figure 9: Example top 10 signatures for vendor
3.3 - Security Incident Dashboard
The Security Incidents dashboard provides a simple self explanatory high level view of your Managed Detection and Response service security incidents.
The Security Incidents dashboard covers up to the last 12 months worth of security incident data.
Current open security incidents per severity
For more information on severity definitions, refer to Security Incident Fields.

Figure 1: Example current open security incidents by severity
Current open security incidents by state
For more information on state definitions, refer to Security Incident Fields.

Figure 2: Example current open security incidents by state
Current open security incidents (days)
This graph helps you understand how long (in days) a security incident has remained open - this could be in ‘Awaiting feedback’ or ‘Awaiting SOC’ states. Ideally the goal is to remediate and close a security incident as quickly as possible to mitigate risk.

Figure 3: Example current open security incidents (days)
New security incidents per month by severity

Figure 4: Example new security incidents per month by severity)
Security incidents average closing time by severity (days)
This graph shows the average closing time (in days) of security incidents per severity. Ideally the goal should be to keep this average closing down to a minimum.

Figure 5: Example security incidents average closing time by severity (days))
Security incidents total opened/closed per month

Figure 6: Example Security incidents total opened/closed per month))
4 - Telemetry
4.1 - Telemetry Monitoring
The Telemetry Monitoring view provides you a clear concise view of any integrations that have a status of Warning and Critical.
Access Telemetry Monitoring
- Click Telemetry in the main menu
- Select Telemetry Monitoring

Figure 1: Telemetry monitoring menu and visual indicator
A visual indicator is displayed beside the Telemetry Monitoring menu item showing the total number of integrations which may require attention.
Summary Panel
Telemetry Monitoring provides a summary of all integrations and their current status.

Figure 2: Example summary information
Possible status and their associated descriptions are outlined in the table below:
| Status | Description |
|---|
| Pending | Telemetry components installing / provisioning or awaiting status |
| Unknown | The SamurAI platform is unable to determine a status or the Vendor/Product are unknown |
| OK | All components healthy |
| Warning | Warning status will be displayed if the SamurAI platform has not seen any events per the defined threshold. |
| Critical | Critical status will be displayed and an email notification will be sent to registered users (by default) if the SamurAI platform has not seen any events per the defined threshold |
Telemetry Monitoring Table
The table lists all integrations for which the SamurAI Platform has not received events according to defined thresholds for Critical and Warning.
 Figure 3: Example detail table
Clicking on the Integration will navigate you to the Integration Details. For integrations of type Log an events graph will be displayed which may help in troubleshooting.
HA Group
- Represents integrations configured in High Availability (HA) mode (e.g. Active/Passive pairs)
- The best member state determines the group’s overall status
- Notifications are sent only for HA groups — not for individual members
- Refer to High Availability and Integrations
Unsupported integrations
- Displayed as Product - unknown and Vendor - unknown
- The SamurAI platform does monitor these telemetry event sources in line with default or customized status thresholds
The Telemetry Monitoring view has the same functionality as the Integration View therefore refer to:
If you want additional information on Integration health, please review How do I know if my integration is functioning?
4.2 - Integrations
What is an Integration?
A data source integrated with the SamurAI platform. An integration allows us to collect and ingest telemetry data from multiple sources, including network, endpoint and cloud.
What integrations are available?
We have pre-built integrations to a comprehensive array of 3rd party products and services. Select Supported Integrations to view what is available.
For syslog sources, even if events do not match a supported Integration, we will still ingest events into our data lake as a Generic Log Source. You will still be able to process this data using Advanced Query, and include events from generic log sources within your queries.
How do I integrate data sources?
Select Create for steps to integrate data sources.
Integration Health
Once you have configured Integrations to bring your data into the SamurAI platform, you will also want to make sure that your data sources are healthy. For more details on how to maintain Integration health and troubleshoot problems, please read our article about Integration Health.
What’s Next?
Upon completion of your integrations and validation of health, the platform will start collecting and ingesting telemetry data. Dependent on your phase of MDR onboarding our team will be in contact with you.
4.2.1 - Supported Integrations
Integrations facilitate the ingestion of data sources from a wide range of third party vendors. Our Integrations are updated regularly as new and emerging technologies are released.
Each Integration typically requires a configuration guide outlining steps you must follow to integrate your data source to the SamurAI platform.
For details such as transport methods and logs collected please refer to each supporting vendor configuration guide by clicking the link in the table or browsing directly to Product Integration Guides.
All supported integrations are categorized according to our Detection Categorization. For further information refer to the following article: Telemetry Data Source Categorization.
If you do not see an integration guide available, please reach out to your NTT contact for further information as we are constantly developing support for additional data sources.
Available configuration guides
In the pipeline
Outlined below are integrations we have in the pipeline however have no committed dates for support. Please note any integration may be influenced by changing business opportunities and client requirements. Please contact NTT for further information or if you require additional support.
| Vendor | Product |
|---|
| Cloudflare | Cloudflare |
| OpenBSD | Packet Filter |
| Skyhigh Security | On-Premises SWG |
| Netskope | Netskope SSE |
4.2.2 - Create
Create Integration
- From the SamurAI Portal click Telemetry and select Integrations from the main menu.
- Click Create integration.
- Select the product you wish to integrate with the SamurAI platform.
- Click Next. Dependent on how we collect telemetry, the product may be integrated via a Cloud Collector or Local Collector. Follow the steps based on the Collector type:
Cloud Collector
- If the integration is cloud-based you need to select the relevant Cloud Collector. Select the relevant Cloud Collector and click Next.
- If you are using a public cloud storage account you should already have completed the steps in Cloud Collector.
- If no cloud storage is utilized then a default cloud collector is available.
- Select Configuration Guide which will direct you to SamurAI documentation outlining how to configure your product and obtain required fields.
- Once you have configured your product, complete the required fields.
- Select Finish.
Local Collector
- Your Local Collector(s) will be listed. Select the Local Collector that you will integrate the product with.
- Click Next (typically this is the syslog destination host when configuring your device). If you do not have a Local Collector setup and deployed, follow the steps in our SamurAI Local Collector article.
- The Local Collector IP Address will be displayed, copy the IP address or take note of it.
- Click Configuration Guide which will direct you to SamurAI documentation outlining how to configure your product.
- Based on the product, Extended Data Collection may be displayed, if so jump to Extended Data Collection.
- Click Finish
You do not need to follow the steps above for a Local Collector integration without extended data collection, however we advise you follow the steps to determine if extended data collection is available for the product, and if you wish to enable it. You may choose to follow our integration guides to send logs directly to your Local Collector, the SamurAI platform will auto detect the vendor and product for supported integrations. If we do not support the product, your integration will be displayed as unknown under the Vendor and Product fields, however the SamurAI platform will still store the telemetry data.
Extended Data Collection
For many products we are able to collect extended data enhancing our threat detection capabilities and accuracy, for example Packet Capture (PCAP) data. This option will be displayed during configuration of an integration.
- If extended data collection is available for the product, you can choose to enable or disable via the toggle. If you choose to disable, Select Finish
- If you choose to enable extended data collection you must complete all the necessary fields. The parameters for each field are derived from following the associated product configuration guide. Once complete, Select Finish
You can choose to follow the configuration guide at anytime during the process, however if your product is not configured, the SamurAI platform will obviously not receive any telemetry.
All supported third-party product configuration guides can be found
here.
4.2.3 - High Availability
If you have products configured in a High Availability configuration e.g. Active/Passive pair you have the option to configure HA Groups.
HA Groups are important for telemetry health monitoring and notifications. An example scenario is if you have an Active/Passive product configuration where the Active node consistently sends data to a local collector, however the Passive node sends intermittent data. In this scenario the Active node status would be reported as OK, however the Passive node status may appear as Critical despite there not being a telemetry ingestion problem.
HA Group telemetry monitoring is handled based on the ‘best’ state of all members e.g in the scenario above if a HA Group has two members and one member has an OK status, and the second member has Critical status the overall group state will be considered OK.
Email notifications are sent per HA Group and not per individual group member.
Create HA Group
HA Groups are limited to integrations of type Log.
- Click Telemetry and select Integrations from the main menu
- Click
 (more options) at the top right of the table and select Create HA Group
 - A Create HA Group window will be displayed
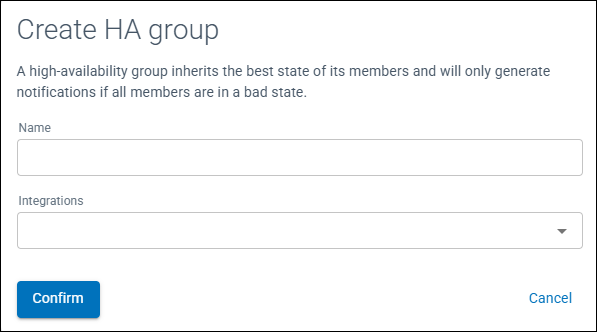
Figure 1: Create HA Group window
- Enter a Name for the HA Group
- From the drop down menu select the integrations to be members of the HA Group
- Click Confirm
Within the Integrations table, the field type HA Group will be displayed with the number of members highlighted.
If you configure HA Groups it is recommended to review and adjust
Status thresholds as necessary for group members.
Edit a HA Group
- Click Telemetry and select Integrations from the main menu
- Click on (more options) to the left of the HA Group and select Edit HA Group
- Add or remove the group members required
- Click Confirm
There must be a minimum of two members of a HA Group, there are no maximum limitations.
Delete HA Group
- Click Telemetry and select Integrations from the main menu
- Click on (more options) to the left of the HA Group and select Delete HA Group
- A confirmation window will be displayed, Click Confirm
The HA Group will be deleted and integrations listed within the table.
4.2.4 - Details and Status
View Integration
There are multiple methods of viewing your integrations.
To view integrations associated with a specific collector:
- From the SamurAI Portal click Telemetry and select Collectors from the main menu
- Select the relevant Collector
- All integrations associated with the Collector will be displayed with associated information
You can also view all integrations regardless of collector:
- Click Telemetry and select Integrations from the main menu
- An Integrations table will be displayed with all of your Integrations listed
Click on the specific integration to view configuration parameters. You can edit and update a description to help keep track of the integration.
A single product integration may be displayed multiple times based on telemetry data ingested. For example, if you enabled
Extended Data Collection whilst
creating an integration the individual product will be displayed multiple times with different
Type fields.
For integrations of type Log an events graph will be displayed. This is a useful indicator of the number of events over a given period and may show spikes and drops in events.
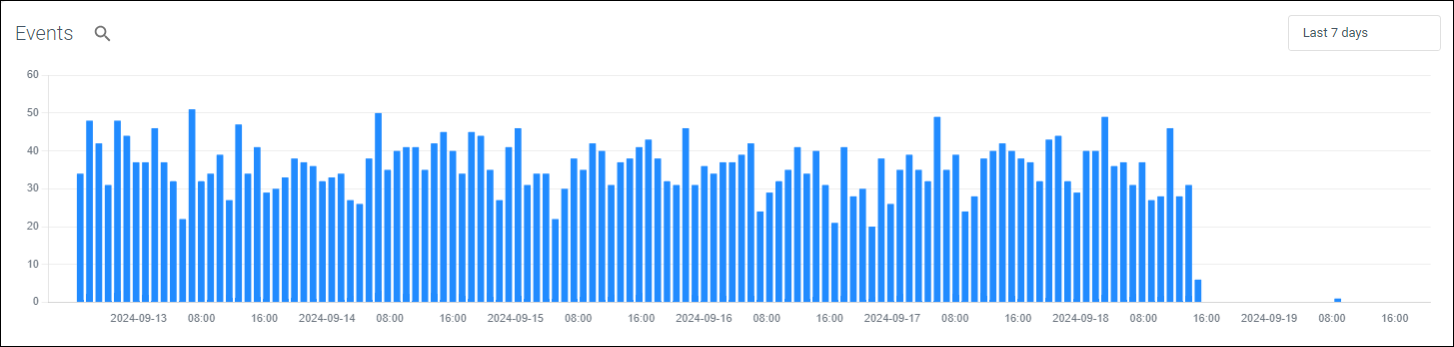
Figure 1: Example events graph
By clicking the time picker you can update the events graph to a specific date and time range. We default to the Last 7 days however have included Quick time ranges.
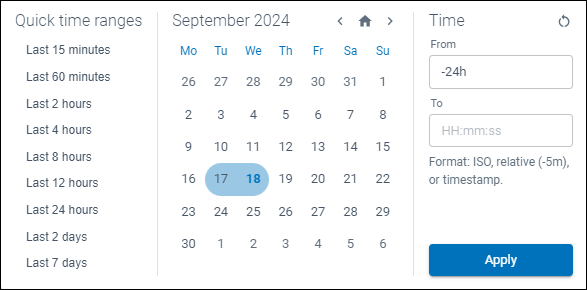
Figure 2: Data and time selector
From the events graph you can pivot directly into Advanced Query by selecting the magnifying glass icon ( ) to view the underlying event data.
Views
You can save filters you set through views. This is useful if, for example, you have a large number of integrations and wish to view only specific products or types of integration.
Click Views to save/reset/delete your different filters. Once saved you can toggle between views.
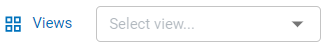
Figure 3: Views drop down
Integration Status
Potential status displayed are included in the table below:
| Indicator | Status | Description |
|---|
| Pending | Telemetry components installing / provisioning or awaiting status |
| Unknown | The SamurAI platform is unable to determine a status or the Vendor/Product are unknown |
| OK | All components healthy |
| Warning | Warning status will be displayed if the SamurAI platform has not seen any events per the defined threshold. Refer to Status Thresholds for additional information |
| Critical | Critical status will be displayed and an email notification will be sent to registered users (by default) if the SamurAI platform has not seen any events per the defined threshold. Refer to Status Thresholds for additional information |
Status Thresholds
Status thresholds are currently limited to integrations of type Log.
The SamurAI platform defines default Warning and Critical thresholds for each integrated product. These thresholds determine when an integration status is reported as Warning or Critical. You can adjust these values per product (e.g for all integrated Palo Alto NG Firewalls) or per integration (e.g for a single Palo Alto NG Firewall). Refer to Custom Thresholds for further information.
To view the default status threshold per product:
- Click on more options (
 ) to the right of the table as depicted:
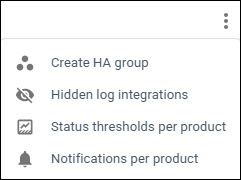
Figure 4: Status thresholds option
- Select Status Thresholds per product
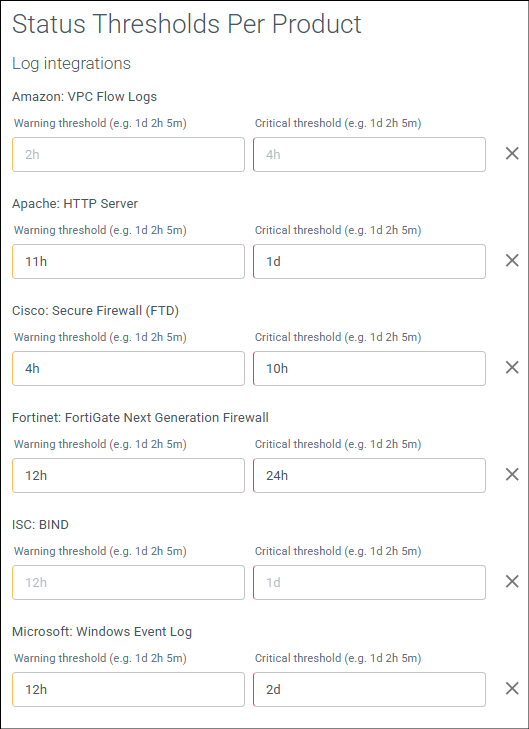
Figure 5: Example default status thresholds per product
Status threshold per product will be displayed, defined in single units or a combination as d (days), h (hours) and m (minutes).
In the example above (Figure 5) for all integrated Cisco: Secure Firewall (FTD) the default thresholds are:
- Warning: 4h. If the SamurAI platform does not receive or ingest any events after 4 hours, the integration status is updated to Warning (displayed within the Integrations Table and the Telemetry Monitoring Table).
- Critical: 10h. If the SamurAI platform does not receive or ingest any events after 10 hours, the integration status is updated to Critical (displayed within the Integrations Table and the Telemetry Monitoring Table, and an email notification is sent to registered users (by default) or as configured by each user.
Custom Thresholds
Custom thresholds are currently limited to integrations of type Log.
Custom thresholds can be set per Product (e.g for all integrated Palo Alto NG Firewalls) and/or per Integration (e.g for a single integrated Palo Alto NG Firewall).
Set thresholds using a single or combination of time units. Use d for days, h for hours and m for minutes e.g 12h or 1d 2h 10m.
Custom thresholds adjusted per Integration will overide Product set thresholds.
Adjust thresholds per Product
- Click on more options () to the right of the table
- Select Status Thresholds per product
- Enter the Warning threshold in days, hours and/or minutes for the Product
- Enter the Critical threshold in days, hours and/or minutes for the Product
- Click Save
Adjust thresholds per Integration
- Click on more options () to the left of the integration
- Select Status Thresholds
- Enter the Warning threshold in days, hours and/or minutes for the integration
- Enter the Critical threshold in days, hours and/or minutes for the integration
- Click Save
Once saved:
- The integration will display an Info icon (
 )
) - Hovering over the icon will display Custom Status Threshold text with the threshold set per status
You can set HA Group thresholds e.g thresholds for all members of the HA Group. You can also set thresholds per member of a HA Group. Member (integration) thresholds will overide the HA Group set thresholds.
Integration Email Notifications
By default email notifications are enabled. The SamurAI platform sends email notifications to registered users when an integration is reported as Critical e.g. the SamurAI platform has not receieved or ingested any data from the integrated product according to the defined threshold, however this is fully customizable.
Email notifications can be set per Product (e.g for all Palo Alto NG Firewalls) and/or per Integration (e.g for a single Palo Alto NG Firewall). Registered users can also customize what email notifications they receive. Refer to User Notifications Settings.
Email notifications adjusted per Integration will overide Product settings.
Enable or disable email notification per Product
- Click on more options () to the right of the table
- Select Notifications Per Product
- Toggle the setting to enable or disable by selecting the bell icon. Alternatively you can select the default setting
- Click Save

Figure 6: Example notification settings
Enable or disable email notification per Integration
- Click on more options () to the left of the integration
- Select Notifications
- A Notifications Settings window will be displayed
- Toggle the setting to enable or disable by selecting the bell icon. Alternatively you can select the default setting
- Click Save
Hide Integration
Hiding an integration will remove it from the integrations displayed and also from the Telemetry Monitoring view and disable notifications.
Only integrations of type Log can be hidden. Some reasons why you may want to hide an integration include:
- You may want to hide all of your unsupported/generic log source integrations.
- And you do not want to receive notifications if there is an issue with telemetry ingestion to the SamurAI platform.
You can also
Disable Notifications if you wish to keep the integration within the integration and monitoring tables.
To hide an integration:
- Find the relevant Log integration within the table
- Click on more options () select Hide integration
- A Hide Log Integration window will be displayed, click Confirm
To view any hidden integrations:
- Click on more options () at the top right of the table and select Hidden log integrations
- A Hidden Log Integrations window will be displayed with hidden integrations
Unhide Integration
- Click more options () at the top right of the table and select Hidden log integrations
- A Hidden Log Integrations window will be displayed
- Find the relevant Hidden integration
- Click on more options () to the left of the integration and select Unhide integration
4.2.5 - Delete
Delete Integration
If you delete an integration, it cannot be reversed! but events from the telemetry source will remain within the SamurAI platform. However if the integration is auto-detected, it will reappear as type log if your telemetry source remains sending logs.
If you wish to delete an integration associated with a specific Collector:
- From your SamurAI Portal Telemetry and select Collectors from the main menu
- Select the relevant collector from your list
- You will now see all integrations associated with the collector
- Select your integrations
- On the right hand side of the relevant integration, click on
 (more options) and select Delete Integration
 - The following warning will appear: ‘Warning: This is a destructive action and cannot be reversed.’. To ensure you intended to delete the integration you will need to type in the highlighted ‘Integration’s Hostname’ and select Delete Integration
You can also delete from the Integrations menu item:
- Click Telemetry and select Integrations from the main menu
- Find and select your integrated product
- On the right hand side of the relevant integration, click on (more options) and select Delete Integration
4.2.6 - Generic Log Sources
While we make an effort to support a wide variety of Integrations and different types of log sources, it is possible that there may be a log source that you would like to ingest into the SamurAI platform which we are not able to parse and analyze. This is especially true for events generated via syslog log sources.
The fact that we are not able to use a log source for detections doesn’t mean that it won’t still be useful to ingest into the SamurAI platform. We will ingest any event data, provided via syslog (sent to a SamurAI local collector), into our data lake and you will still be able to analyze that event data using Advanced Query. This allows you to include events from generic log sources when you are performing queries.
If you configure an unsupported log source to send syslog to a SamurAI local collector it will be displayed in the SamurAI Portal under Vendor and Product as unknown. However you can provide a description to allow you to keep track of them. Refer to [Integration Articles(/docs/user_guide/telemetry/integrations) for providing a description.
If a log source, ingested via syslog, does not match one of our supported integrations, we will ingest the log events, which will still contain, amongst others, the following fields:
- timestamp: the time at which the log message was ingested
- collector: the id of the collector which ingested the event
- host: the source host from which the event was received
- raw: the complete raw log message
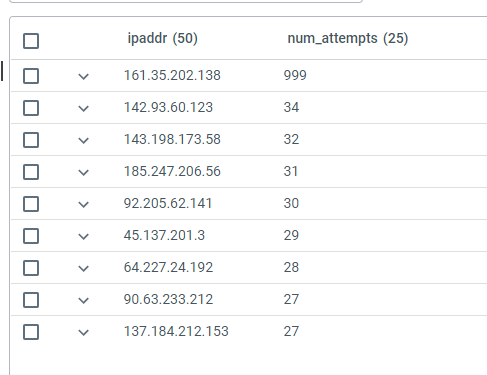
You can then proceed to query these events using Advanced Query. For example, the following KQL query finds all the attempts to connect to a host using invalid user ids and then counts the attempts by source IPv4 or IPv6 address:
events | where host == "10.1.1.1" and i(raw contains "Invalid" or raw contains "failed") and raw !contains "connect" | project timestamp, user = extract("user ([a-zA-Z0-9\\-]+) from ", 1, raw), ipaddr = extract(".+ ([0-9a-f]+[\\:\\.][0-9a-f\\.\\:]+) ", 1, raw) | summarize num_attempts = count() by ipaddr| order by num_attempts
The output is ordered by the number of attempts from each IP address, producing a table like the following:
4.3 - Collectors
What is a SamurAI Collector?
SamurAI Collectors are used to receive and transport telemetry from your security controls, network devices or cloud services to the SamurAI platform.
There are two types of collectors:
1. Cloud Collector
- Deployed within the SamurAI platform and is used to gather telemetry from cloud services and/or security controls. Various use cases exist with differing requirements based on the Product/Service you are integrating with SamurAI:
- In some cases you simply need to complete the relevant integration and the cloud collector is automatically used.
- When we gather telemetry from public cloud storage (specifically Microsoft Azure storage accounts and Amazon Web Services (AWS) S3 buckets) you must first deploy a cloud collector within the SamurAI platform that is used to monitor your cloud storage for updated telemetry files.
- When we ingest telemetry using Splunk HTTP Event Collection (HEC) you must also first deploy a cloud collector within the SamurAI platform that is used to receieve telemetry data.
Requirements are clearly stated in the relevant Product Integration Guides.
2. Local Collector
- Deployed within your environment and is used to gather telemetry from your security controls and network devices. We have packaged the local collector to support multiple formats and envionments.
What type of Collector do you require?
This is dependent on the products you want to integrate with SamurAI:
- For products deployed in your internal network, a Local Collector will be required to gather (pull & push) telemetry data and securely transfer it to the SamurAI platform.
- For cloud based products providing API endpoints, a Cloud Collector will be used to pull the telemetry data and securely transfer it to the SamurAI platform.
- For cloud based products utilizing streaming of telemetry data to cloud storage, a Cloud Collector is also required to retrieve the telemetry data and securely transfer it to the SamurAI platform.
- For products that leverage streaming of telemetry via Splunk HTTP Event Collection (HEC), a Cloud Collector is required to receieve telemetry data to the SamurAI platform.
Next steps:
- Review our Supported Integrations and associated Integration Guides to determine the collector type(s) required. Within each Integration Guide there is a table denoting use of a Local or Cloud Collector, alternatively this is displayed in the SamurAI Portal when working through an integration.
- You may also choose to jump directly to the SamurAI Portal and review integrations
- If you have determined you require a local collector then click on SamurAI Local Collector and follow the steps to create, configure and install.
- If you have determined you require a cloud collector then click on SamurAI Cloud Collector and follow the steps to create and configure.
4.3.1 - SamurAI Local Collector
If you have determined that you require a local collector then follow the steps below to learn what you need to get started, create, configure and download a local collector from the SamurAI Portal and ensure it is working as expected.
- Take a moment to understand what you need to get started
- Create, configure and download a Collector
- Install a Collector
- Validate Collector Status
- Collector Status Notifications
- What’s next?
- Deleting a Collector
What you need to get started
Access to the SamurAI Portal and your specific tenant.
A hypervisor to run the virtual machine, for example VMware vSphere, Microsoft Hyper-V, Amazon EC2 or Azure Virtual Machine
Ensure to make any necessary updates to comply with the collectors connectivity requirements.
A static IP address for the collector and DNS server IP addresses unless you decide to use DHCP.
Access to your products to make necessary changes outlined within the relevant integration guide.
Minimum Virtual Machine Requirements
The following machine requirements will support up to 15K events per second (EPS) peak, 10K EPS sustained over a 24hr period, approx 800GB per day.
| Resource | Requirement |
|---|
| CPU | 2 vCPU |
| Disk | 500GB disk |
| Memory | 4 GB |
Connectivity required for the Collector
The collector requires connectivity to resources outlined within the table below, you may need to update your security controls e.g firewall to allow this connectivity.
| Function | Protocol | Port | Source | Destination | Details |
|---|
| Enrolment, Telemetry | TCP | 443 | Collector | *.*.security.ntt
nttsecurity.io
.nttsecurity.io
.*.nttsecurity.io
samurai-xdr-prod-westeurope-xgliuoit.azure-api.net | All regular backend communication, telemetry |
| Remote Management | TCP | 443 | Collector | ra.cto.nttsecurity.io
deb.releases.teleport.dev
apt.releases.teleport.dev | Used for remote administration of collector (this is not mandatory and used when troubleshooting) |
| NTP | UDP | 123 | Collector | Client infrastructure (NTP server(s)) if configured in SamurAI Portal
OR
0.ubuntu.pool.ntp.org
1.ubuntu.pool.ntp.org
2.ubuntu.pool.ntp.org
3.ubuntu.pool.ntp.org | Time synchronization |
| DNS | UDP | 53 | Collector | Client infrastructure (DNS server(s)) or external DNS servers (based on your collector configuration) | Domain name resolution |
| Ubuntu updates | TCP | 80, 443 | Collector | *.ubuntu.com
api.snapcraft.io | Ubuntu software repository |
| Container Management | TCP | 443 | Collector | docker.com
*.docker.com (private container registry)
docker.io (private container registry)
*.docker.io (private container registry) | Private container registry |
| Amazon Cloud dependencies | TCP | 443 | Collector | *.cloudfront.net | Amazon CDN used by Collector API |
| Log storage | TCP | 443 | Collector | *.s3.*.amazonaws.com | Amazon Cloud storage (this is not mandatory and used when troubleshooting) |
| Telemetry data | (based on product - see Integration guide) | Client Product | Collector | Frequent data transfer (based on product) | |
Login to the SamurAI Portal, click Telemetry and select Collectors from the main menu
Select Create Collector
Select Local collector
Complete the fields as required.
| Collector name | A nickname for the collector |
|---|
| Description (Optional) | A description of your collector, this could be the property name where installed |
| Location (Optional) | Useful if you have collectors in multiple locations |
| Hostname | A hostname for your collector |
| Proxy Server IP (Optional) | Optional HTTP proxy server (URL that contains a hostname or IP address with port e.g https://192.168.1.254:8080) |
| NTP Servers (Optional) | Input your own NTP server IP addresses |
| DHCP or Static | Determine whether the collector will use DHCP or specify your own static IP address and network information |
Select Create Collector once you have completed all relevant fields
Select the Collector you created by clicking the Name used in Step 2
Select Download
- Download the iso configuration file and also the relevant file needed for your hypervisor.
If you are creating multiple collectors, you only need to download the ova file once and can use it multiple times, the important file per collector is the configuration file (iso).*
Install a Collector
Based on your hypervisor follow the relevant section:
VMware vSphere
If you deploy the Collector in Vsphere 8 and later ensure Virtual Machine Compatibility is set to ESXi 7.
Follow the documentation from VMware:
- When asked to provide a virtual machine name, we suggest samurai-nttsh-collector
- Be sure to select the .ova file you downloaded when asked for the file to deploy your virtual machine from.
Once complete follow the VMware article to configure a datastore ISO file
- Be sure to select the .iso file you downloaded when asked to select file
The VM is now ready to be powered on.
The .iso file must be mounted at first boot to configure the Collector. Once you have
validated the Collector status is Healthy in the SamurAI Portal you must ensure the .iso is dismounted.*
Microsoft Hyper-V
Follow the documentation from Microsoft:
- When asked to provide a virtual machine name, we suggest samurai-nttsh-collector
- Use the Virtual Machine Requirements when configuring memory and network
- When asked to Connect Virtual Hard Disk ensure to use the .vhdx file you previously downloaded
- For Installation Options ensure you use the .iso file you previously downloaded
Once you have completed setup of your Collector you should ensure it is running and validate the status within the SamurAI Portal, upon initial setup this can take a little while.
Amazon EC2
Prerequisitve steps:
- Ensure you have the AWS cloud-init.yaml file you downloaded from Create, Configure and Download a Collector.. This file will be used later during EC2 instance deployment.
Follow the vendor documentation from Amazon to launch a EC2 instance:
Perform the following adjustments to the vendor documentation when launching the instance:
- During step 4.a, select Ubuntu as AMI.
- During step 4.b*,* select the latest Ubuntu AMI
- During step 5*,* select a suitable Instance Type based on estimated performance requirements while fulfilling the Minimum Virtual Machine Requirements.
- During step 6 & 7, Set Key pair & Network Settings as per your AWS policies. Ensuring the the Network settings still fulfills the Connectivity required for the Collector.
- Before step 8, modify the Configure storage section with the following settings:
- Adjust the Root Volume to be at least 64 GiB.
- Add a secondary volume with at least 500 GiB according to the Minimum Virtual Machine Requirements.
Secondary disk volume will be used for spooling, size it according to estimated log volume and max downtime.
- Before step 8, expand the section Advanced details and paste in the content of the cloud-init.yaml file into the User data section. Ensure that the check box User data has already been base64 encoded is not enabled.
- Proceed with step 8 and finish the rest of the installation as per the vendor documentation.
Azure Virtual Machine
Prerequisite steps:
- Ensure you have the Azure cloud-init.yaml file you downloaded from Create, Configure and Download a Collector.. This file will be used later during the Virtual Machine instance deployment.
Follow the vendor documentation from Microsoft to launch a Virtual Machine instance:
Perform the following adjustments to the vendor documentation when launching the instance:
- Under the Basic tab, select Ubuntu Server 22.04 LTS as image
- Under the Basic tab, select a suitable Size based on estimated performance requirements while fulfilling the Minimum Virtual Machine Requirements.
- Under the Disk tab, add one data disk with at least 500 GiB according to the Minimum Virtual Machine Requirements.
Data disk volume will be used for spooling, size it according to estimated log volume and max downtime.
- Under the Advanced tab, paste the contents of cloud-init.yaml in the Custom datafield.
All other settings such authentication, network configuration and monitoring should be configured according to company policy and best practices.*
Validate Collector Status
Click Telemetry and select Collectors from the main menu
Select the relevant Collector from the presented list
View Status
| Indicator | Status | Description |
|---|
| Pending | Collector components installing / provisioning or awaiting status |
| Unknown | The SamurAI platform is unable to determine a status |
| OK | Healthy |
| Warning | Warning status will be displayed if the Collector is experiencing any issues e.g components are experiencing problems |
| Critical | Critical status will be displayed and an email notification will be sent to registered users (by default) if the SamurAI platform cannot communicate with the Collector |
After you provision a Collector VM and start it, it will go through a process of installing updates and modules specified in the configuration ISO file which you downloaded. The time taken for this process is dependent on factors like the speed of the hardware you are running the Collector on and connectivity to the repositories that it downloads updates from. In some cases this process can take around 30 minutes.
If you have any problems, please submit a ticket via the SamurAI Portal.
If your Local Collector is being proivisioned or has been restarted, the Collector may cycle through multiple status updates, this is not cause for alarm as this typically occurs for a short period of time as processes restart. Once complete your Local Collector status will be displayed as OK.
Collector Email Notifications
By default email notifications are enabled. The SamurAI platform sends email notifications to registered users when a Collector is reported as Critical (e.g. the SamurAI platform cannot communicate to the Collector) however this is customizable by users for any Collector status.
SamurAI Portal users can opt in or out of email notifications for any status. Please review
Notifications Settings.
Enable or Disable Email Notifications
- Click on More Options () to the right of the table
- Select Notifications
- Toggle the setting to enable or disable by selecting the bell icon. Alternatively you can select the default setting
- Click Save
You can also achieve this per individual Collector by:
- Click on More Options () to the left of the Collector
- Select Notifications
- Toggle the setting to enable or disable by selecting the bell icon. Alternatively you can select the default setting (send notification).
- Click Save
If your Local Collector is being proivisioned or has been restarted, the Collector may cycle through multiple status updates, this is not cause for alarm as this typically occurs for a short period of time as processes restart. Once complete your Local Collector status will be displayed as OK.
What’s next?
You should now have a collector running within your environment!
The next step is to start configuring integrations which will allow the SamurAI platform to start receiving your telemetry data.
Select Integrations Overview for more information on integrations and where to start.
If you require high availability for your collector, this can be achieved using the capabilities of your virtualization platform.
Deleting a Collector
If you delete a local collector it cannot be reversed! In addition, all of your integrations related to the local collector will also be deleted!
If you need to delete a local collector you can do so by following the steps below:
- From your SamurAI Portal click Telemetry and select Collectors
- Select the relevant collector from your list
- On the right hand side of the relevant collector, click on More Options () and select Delete Collector
- The following warning will appear: ‘Warning: This is a destructive action and cannot be reversed.’. To ensure you intended to delete the collector you will need to type DELETE in the field and select Delete Collector
Replacing a Collector
If for some reason a Local Collector VM is lost due to corruption or damage, such as in the case of a major disk storage failure, you may need to replace your Collector. If this happens, you will need to delete the old Collector in the SamurAI Portal, discard your old Collector VM image and then create a new Collector using the process described to Install a Collector.
- If you need to replace a Collector VM, you cannot re-download the installer ISO for an existing Collector and redeploy it. You must delete the old Collector and replace it with a new one.
- You can re-use the same IP address as your old Collector. This allows you to replace a Collector without re-configuring any log sources which were sending logs to the old Collector.
- When replacing a Collector, any Integrations which were automatically detected and attached to the original Collector will be automatically detected and attached to the new Collector.
- Once you have created the new Collector, you will need to add any Integrations which you were previously using and which you had to previously manually add to the old Collector.
4.3.2 - SamurAI Cloud Collector
Deployed within the SamurAI platform, Cloud Collectors are used to:
- Pull telemetry data via an API and securely transfer it to the SamurAI platform.
- Retrieve telemetry data from public cloud storage (Microsoft Azure storage accounts and Amazon Simple Storage Service - S3). The collector monitors for new or updated files in cloud storage and pulls the data into the SamurAI platform for ingestion.
- Receieve telemetry data for ingestion to the SamurAI platform (Splunk HTTP Event Collection - HEC).
The need for a Cloud Collector is based on the specific product being integrated with the SamurAI platform. This will be clearly indicated within the Product Integration Guide.
- For integrations where we leverage an API, you can simply follow the integration guide as a cloud collector will already be available.
- For integrations where we leverage collection of telemetry data from public cloud storage or receipt via Splunk HTTP Event Collector (HEC) there are steps you will need to follow as outlined in the section below Create Cloud Collector.
Create Cloud Collector
For public cloud storage we recommend a minimum cloud storage retention period of 7 days (our template default), however you can update as necessary if a longer retention period is required.
From the SamurAI Portal, click Telemetry and select Collectors from the main menu
Select Create Collector
Select Cloud collector
Complete the fields as required.
| Field | Description |
|---|
| Collector name | A name for the collector |
| Description (Optional) | A description of your collector |
| Provider | Select the correct Provider |
Select Create Collector
Follow the relevant section below based on your provider.
Microsoft Azure
- Click Deploy to Azure and you will be redirected to the Microsoft Azure login.
The Deploy to Azure button will only be displayed once after selecting Create Collector, therefore be sure to click the button before closing the dialog window.
- An Azure Resource Manager (ARM) template will be launched, follow the steps and complete the necessary fields within the template:
Project Details
| Field | Description |
|---|
| Subscription | Select your Azure subscription |
| Resource Group | Create or select your Resource Group |
Instance Details
| Field | Description |
|---|
| Region | Select the Azure region to deploy the Collector into |
| Collector Name | (this is auto populated from the SamurAI Portal Collector name you defined) |
| Collector Id | (this is auto populated from SamurAI) |
| Passkey | (this is auto populated from SamurAI) |
Select Next
Select Review and Create
Upon creation your Collector status will be updated to Healthy.
You can now refer to the relevant Product Integration Guides.
Amazon Web Services (AWS)
- Click Launch Stack and you will be redirected to the AWS login.
The Launch Stack button will only be displayed once after selecting Create Collector, therefore be sure to click the button before closing the dialog window.
Login to your AWS account with administrative permissions.
The SamurAI cloud formation template will be displayed.
If you have an existing S3 Bucket enter the name within the Parameters section under Enable SamurAI ingestion on existing S3 bucket. If you have no existing S3 bucket, leave this field blank and a new S3 bucket will be created.
If you are integrating Cisco Umbrella, be sure to update Cisco Umbrella under the Parameters section to Yes.
Click Create Stack.
Upon creation of the stack your Collector status will be updated to Healthy.
You can now refer to the relevant Product Integration Guides.
Additional required steps when using an existing bucket
- Add the following to the bucket policy, please update the json with the correct bucket name.
 {
    "Effect": "Allow",
    "Principal": {
        "AWS": "arn:aws:iam::600502389717:user/samurai-xdr-s3-reader-user"
    },
    "Action": [
        "s3:GetObject",
        "s3:ListBucket"
    ],
    "Resource": [
        "arn:aws:s3:::BUCKET_NAME",
        "arn:aws:s3:::BUCKET_NAME/*"
    ]
}
Create an Event Notification in the bucket properties.
Enter an Event Name for the notification, leave the Prefix and Suffix boxes blank.
Select All object create events
Under Destination, select SNS Topic and select the SNS topic that was created by the Cloud Formation Template from the drop down and click Save Changes.
Splunk HTTP Event Collector
- If you selected this option you will be presented with the following information:
Copy these entries as you will need them when completing your integration.
The API information is only displayed once after clicking Create Collector therefore be sure to save the information before clicking close.
Select Close.
You can now refer to the relevant Product Integration Guides.
Validate Collector Status
Select Telemetry and Collectors from the main menu
Select the relevant Collector from the presented list
View Status
| Indicator | Status | Description |
|---|
| Pending | Collector components installing / provisioning or awaiting status |
| Unknown | The SamurAI platform is unable to determine a status |
| OK | Healthy |
| Warning | Warning status will be displayed if the Collector is experiencing any issues e.g components are experiencing problems |
| Critical | Critical status will be displayed and an email notification will be sent to registered users (by default) if the SamurAI platform cannot communicate with the Collector |
Collector Email Notifications
By default email notifications are enabled. The SamurAI platform sends email notifications to registered users when a Collector is reported as Critical (e.g. the SamurAI platform cannot communicate to the Collector) however this is customizable by users for any Collector status.
SamurAI Portal users can opt in or out of email notifications for any status. Please review
Notifications Settings.
Enable or Disable Email Notifications
- Click on More Options () to the right of the table
- Select Notifications
- Toggle the setting to enable or disable by selecting the bell icon. Alternatively you can select the default setting
- Click Save
You can also achieve this per individual Collector by:
- Click on More Options () to the left of the Collector
- Select Notifications
- Toggle the setting to enable or disable by selecting the bell icon. Alternatively you can select the default setting (send notification).
- Click Save
What’s next?
You should now have a collector running.
The next step is to start configuring integrations which will allow the SamurAI platform to collect your telemetry data.
Select Integrations Overview for more information on integrations and where to start.
Deleting a Collector
If you delete a Cloud collector it cannot be reversed! In addition, all of your integrations related to the collector will also be deleted!
If you need to delete a Cloud collector you can do so by following the steps below:
- From your SamurAI Portal click Telemetry and select Collectors from the main menu
- Select the relevant collector from your list
- On the right hand side of the relevant collector, click on More Options () and select Delete Collector
- The following warning will appear: ‘Warning: This is a destructive action and cannot be reversed.’. To ensure you intended to delete the collector you will need to type DELETE in the window and select Delete Collector
4.4 - Network Traffic Analyzer (NTA)
What is the NTA?
The SamurAI Network Traffic Analyzer (NTA) is a virtual appliance designed to provide deep visibility into network activity and detect suspicious or malicious behaviour. It can be deployed in a virtual environment or as an AWS EC2 instance, enabling passive monitoring and analysis of east-west and north-south traffic for security threats and anomalies.
The NTA compliments existing security measures, delivering deeper insight into traffic and potential risks. Our approach leverages core capabilities to maximize protection and visibility:
Advanced Analytics
- Utilizing machine learning and behavioral analysis, the SamurAI Real-Time Engine (deployed on the NTA) identifies anomalous network activities that could indicate security threats, even those that evade traditional detection methods.
Cyber Threat Intelligence Integration
- We apply our global threat intelligence feeds to enrich network data with context about known malicious actors, emerging threats, and attack patterns. This enhances the accuracy and speed of threat detection.
Network Layer Threat Hunting
- The ability to proactively hunt for threats at the network layer, our SamurAI SOC analysts can identify suspicious patterns and indicators of compromise that automated systems might miss.
Full Packet Capture (PCAP)
- With full packet capture capabilities, the SamurAI NTA allows for comprehensive forensic analysis. In the event of a security incident, SamurAI SOC analysts can reconstruct sessions and examine payloads to understand the full scope and impact of the breach.
What are example use cases for the NTA
- Clients with bespoke or unsupported systems e.g no current integration
- Clients who want to expand their monitoring capabilities leveraging NTTs global threat intelligence
- Clients who want to expand monitoring beyond telemetry data sources integrated into SamurAI MDR, or have systems that do not produce telemetry data with limited threat detection capabilities, refer to Telemetry Data Source Categorization to understand how SamurAI categorizes supported integrations
- Clients who wants to get a quick cyber security grip on new acquisitions
- Clients with distributed branch offices with heterogenous environments and no central log collection
What are the components of the NTA?
The NTA gains visibility of network traffic through traffic mirroring. The NTA monitors the traffic utilizing specific components and generates security detections (alerts) which are sent to the SamurAI platform and triaged, investigated and validated by SOC analysts potentially leading to a security incident reported to you. Refer to the high level diagram below:

Figure 1: The NTA internal components
Traditional IDS Meets Advanced Analytics
- The NTA includes a traditional Intrusion Detection System (IDS) component (Suricata), which provides baseline network monitoring. However, its true strength lies in its ability to decode network protocols, converting them into detailed activity logs.
Real-Time Detection with Advanced Analytics
- These activity logs are processed by the NTA resident SamurAI Real-Time Engine, which applies:
- Advanced Analytics to identify subtle anomalies.
- Threat Intelligence to detect known malicious patterns.
- This approach ensures a proactive, accurate understanding of network activity.
Full Traffic Recording (Stenographer)
- The NTA records all traffic flowing through its sensor.
- This enables comprehensive forensics and retrospective analysis, providing critical insights into historical activity.
Automatic Alert Data Collection
- When an alert is triggered, the NTA automatically captures related packet data and sends it upstream to the SamurAI platform for investigation by SOC Analysts.
- This allows for immediate analysis and a deeper understanding of a potential incident.
What data is analyzed by the NTA?
All network traffic you decide to mirror to the NTA is analyzed. The NTA operates passively monitoring the mirrored traffic without introducing latency or affecting production systems. Even when network traffic is encrypted (e.g HTTPS, SSL/TLS), the NTA can still extract and analyze unencrypted meta data such as IP addresses, port numbers, traffic patterns and correlate this metadata with Threat Intelligence such as known malicious IPs, domains or abnormal behaviors - the NTA can identify potential threats and suspicious activity maintaining effective threat detection without decrypting the payload.
If a client has the capability to decrypt traffic before mirroring to the NTA it is of course advantageous, however we recognize this may not be optimal or available in many cases.
All data resides local to the NTA. Any security detections (alerts) made by the NTA coupled with PCAP data is sent to the SamurAI platform for investigation by SOC Analysts.
What are the deployment options?
There are two options for deploying the SamurAI NTA, both options cover network traffic visibility but are deployed and configured differently.
- Deployment on virtual system(s)
- Deployment on an AWS EC2 instance
Who is responsible for the NTA?
You, the client is responsible for installation and configuration of the NTA including the underlying hypervisor/virtual machine settings and/or AWS EC2 configuration and settings.
The SamurAI team is responsible for ensuring health and availability of the NTA which includes maintenance of the Operating System and installed software.
SamurAI will send email notifications to registered users should your NTA encounter any problems, once any issues have been resolved you will be notified again when a healthy status is reached.
If the SamurAI team determines that an NTA is oversubscribed we will liaise with you to determine the best plan forward - this could include requesting you to update assigned virtual resources.
Can I get assistance with deployment of an NTA
Yes, if you require help and guidance with NTA deployment and configuration we can help via the SamurAI Onboarding service. The service is typically utilized by new SamurAI MDR clients to support transition onto SamurAI Managed Detection and Response (MDR) but also for clients who wish to expand or review existing commitment including the NTA.
What’s Next?
Review the requirements to determine what is needed before deployment and configuration of an NTA.
4.4.1 - Requirements
What you need to get started
Access to the SamurAI Portal and your specific tenant.
A hypervisor to run the virtual machine, for example VMware ESXi, Microsoft Hyper-V or relevant access to AWS for deployment to an Amazon EC2 instance.
Make any necessary updates to comply with the NTA Communications Requirements.
A static IP address for the NTA management interface and DNS server IP addresses unless you decide to use DHCP.
Necessary access to configure traffic mirroring to the NTA.
The NTA requires two network interfaces, 1 interface for management for secure outbound communication to the SamurAI platform and 1 interface for traffic monitoring (we currently only support 1 monitoring interface).
Supported Hypervisors
The NTA supports the follows hypervisors and versions:
| Hypervisor | Version |
|---|
| VMware ESXi | 7.x and above |
| Microsoft Hyper-V | 2016 and above |
| Proxmox Virtual Environment | 8.4.1 and above |
Amazon Web Services Support
For AWS deployment, the NTA requires use of AWS Nitro instances that support traffic mirroring, more information can be found at:
Recommended Specifications
There are two NTA sizes which are based on network throughput, therefore note the specifications based on your requirements.
| Medium | Large |
|---|
| Throughput | 500 Mbit/s | 1000 Mbits/s |
| CPU | 8 Cores | 8 cores |
| Memory | 52 GB RAM
(32 GB RAM for OS and 20GB RAM for ramdisk) | 104 GB RAM
(64 GB RAM for OS and 40GB RAM for ramdisk) |
| Disks | System disk: 300GB
Data disk 200GB | System disk: 300GB
Data disk 200GB |
| Network Interfaces | Management:1 x 1 Gbit/s
Network Monitoring:1 x 1 Gbit/s | Management:1 x 1 Gbit/s
Network Monitoring:1 x 1 Gbit/s |
Communication Requirements
The NTA requires connectivity to resources outlined within the table below, you may need to update your security controls e.g firewall to allow this connectivity.
| Function | Protocol | Port | Source | Destination | Details |
|---|
| Enrolment, NTA backend | TCP | 443 | NTA | *.*.security.ntt
nttsecurity.io
.nttsecurity.io
.*.nttsecurity.io
samurai-xdr-prod-westeurope-xgliuoit.azure-api.net | All regular backend communication |
| Remote Management | TCP | 443 | NTA | ra.cto.nttsecurity.io
deb.releases.teleport.dev
apt.releases.teleport.dev | Remote administration of an NTA |
| NTP | UDP | 123 | NTA | Client infrastructure (NTP server(s)) if configured in SamurAI Portal
OR
0.ubuntu.pool.ntp.org
1.ubuntu.pool.ntp.org
2.ubuntu.pool.ntp.org
3.ubuntu.pool.ntp.org | Time synchronization |
| DNS | UDP | 53 | NTA | Client infrastructure (DNS server(s)) or external DNS servers (based on your NTA configuration) | Domain name resolution |
| Ubuntu updates | TCP | 80, 443 | NTA | *.ubuntu.com
api.snapcraft.io | Ubuntu software repository |
| Container Management | TCP | 443 | NTA | docker.com
*.docker.com (private container registry)
docker.io (private container registry)
*.docker.io (private container registry) | Private container registry |
| Amazon Cloud dependencies | TCP | 443 | NTA | *.cloudfront.net | Amazon CDN used by NTA API |
What’s Next?
Now you have an understanding of the recommended specifications and communication requirements we recommend you proceed to SamurAI NTA Deployment
4.4.2 - Deployment
Deployment Considerations
Traffic Source
The NTA is a passive device and relies on client infrastructure to stream a copy of network traffic to the NTA’s monitoring interface. When deploying an NTA in a virtual environment or on AWS EC2, several key considerations should be addressed to ensure effective monitoring and minimal impact on performance:
Resource Allocation
- Ensure the NTA meets the recommended specifications. In some circumstances the resources may not be sufficient and we will work with you on any modifications we recommend based on your traffic throughput once the NTA is deployed and running.
Multi-NTA Deployments
- If your network throughput figures exceed what a single NTA can accomodate you have the option to deploy multiple NTA’s to ensure coverage.
Network Topology and Segmentation
- Map out the virtual network topology and identify where the NTA should be deployed for optimal coverage e.g east-west traffic which typically flows between VM’s connected in the same virtual switch or virtual network, or EC2 instances in the same VPC. Additionally north-south traffic which typically flows between internal and external networks such as web traffic.
Traffic Visibility
- A stream copy of data needs to be provided to the NTA monitoring interface.
Recommendations
Traffic visibility is dependant on your environment, to ensure the best use cases for threat detection in general we recommend:
- Client to internet traffic
- Client to client traffic
- Client to server traffic
Specific traffic which is typically not useful:
- Encrypted traffic e.g any traffic between servers that is encrypted and significant in numbers
- SAN / Backup traffic
Capturing traffic requires configuration of network mirroring or traffic monitoring as outlined below based on your deployment:
Virtual Environment
- Network mirroring on a virtual switch is a method used to capture and analyze traffic passing through a virtual machine (VM) or virtual networks. This is typically achieved by configuring a port mirror, where a copy of the network traffic from one or more source ports is sent to a designated mirror port i.e the NTA mirror interface.
- In a virtualized environment, network mirroring and promiscuous mode can be configured on a virtual switch (such as those in VMware vSphere, Microsoft Hyper-V or others) to facilitate traffic analysis without affecting the networks performance.

Figure 1: The NTA in a virtual environment
Amazon EC2
- For deployment on an EC2 instance, VPC Traffic Mirroring is utilized which allows you to copy traffic from an Elastic Network Interface (ENI).

Figure 2: The NTA running atop AWS
Login to the SamurAI Portal, click Telemetry and select Network Traffic Analyzer from the main menu
Select Create
Complete the fields as required.
| Field | Description |
|---|
| NTA name | A name for the NTA |
| Description (Optional) | A description of your NTA |
| Location (Optional) | Useful if you have NTAs in multiple locations |
| Hostname | A hostname for your NTA |
| Proxy Server address (Optional) | Optional HTTP proxy server (URL that contains a hostname or IP address with port e.g https://192.168.1.254:8080) |
| NTP Servers (Optional) | Input your own NTP server IP addresses |
| Size | Select the appropriate Size based on throughput |
| DHCP or Static | Determine whether the NTA will use DHCP or specify static IP address and network information |
Select Create NTA once you have completed all relevant fields
Select the NTA you created by clicking the NTA Name used in Step 3
Select Download
- Download the appropriate files for your deployment.
NTA Installation
Based on your chosen deployment follow the relevant section:
Most 1 Gbit/s network interfaces are running in Full-Duplex mode (1 Gbit TX and 1 Gbit RX/s), resulting in an actual maximum throughput of 2 Gbit/s.
Be sure to consider this during sizing and solutioning of the NTA. For example, use multiple NTAs and leverage a load balancer if the throughput is at risk of exceeding NTA capacity. This would require that the mirroring technology used supports traffic splitting (typically based on VLAN, IP’s, Net ranges).
VMware vSphere Installation
Follow the documentation from VMware:
- Provide a virtual machine name.
- Be sure to select the .ova file you downloaded when asked for the file to deploy your virtual machine from.
Once complete follow the VMware article to mount the config ISO file
- Be sure to select the .iso file you downloaded when asked to select file
- The management interface will by default be Network Device (net0)
- The monitoring interface will be by default Network Device (net1) - ensure it is connected to your monitoring network.
- The VM is now ready to be powered on.
- Jump to Deployment Status for next steps.
The .iso file must be mounted at first boot to configure the NTA, after which ensure the .iso should be dismounted or removed.
Proxmox VE Installation
Follow the documentation from Proxmox:
- Follow the steps to first setup a new storage for an import source.
- Refer to the OVA/OVF Import section to import the OVA file you downloaded from the SamurAI Portal.
- Import the NTA configuration ISO file to Proxmox
- Navigate to the Datacenter - Storage section
- Select the storage where you want to store the ISO file
- Click on ISO Images

- Click Upload
- Choose the NTA ISO file and upload it using default settings

- Configure the NTA virtual machine to use the NTA configuration file
- Select the NTA virtual machine and click on Hardware and then Add

- Select CD/DVD Drive

- Check Use CD/DVD disk image file (iso) and locate your NTA configuration file. Click Add

- The management interface will by default be Network Device (net0)
- The monitoring interface will be by default Network Device (net1) - ensure it is connected to your monitoring network
- The VM is now ready to be powered on.
- Jump to Deployment Status for next steps.
The .iso file must be mounted at first boot to configure the NTA, after which ensure the .iso should be dismounted or removed.
Microsoft Hyper-V Installation
Follow the documentation from Microsoft:
- Provide a virtual machine name
- Use the Virtual Machine Requirements when configuring memory and network
- When asked to Connect Virtual Hard Disk ensure to use the .vhdx file you previously downloaded
- For Installation Options ensure you use the .iso file you previously downloaded
- The management interface will by default be Eth0
- The monitoring interface will be by default Eth1 - ensure it is connected to your monitoring network
- The VM is now ready to be powered on.
- Jump to Deployment Status for next steps.
Amazon EC2 Installation
Prerequisitve steps:
- Ensure you have the AWS cloud-init.yaml file you downloaded from Create, Configure and Download an NTA.. This file will be used later during EC2 instance deployment.
Follow the vendor documentation from Amazon to launch a EC2 instance:
Follow the steps outlined in Launch an instance
Perform the following adjustments to the vendor documentation when launching the instance:
- During step 5.a, select Ubuntu as AMI.
- During step 5.b*,* select the latest Ubuntu 24.04 Server AMI
- During step 6*,* select a suitable Instance Type based on estimated performance requirements while fulfilling the Recommended Specifications.
- During step 7 & 7, Set Key pair & Network Settings as per your AWS policies. Ensuring the the Network settings still fulfills the Communications Requirements.
- Before step 9, modify the Configure storage section based on the appropriate NTA size disk requirements.
- Before step 9, expand the section Advanced details and paste in the content of the cloud-init.yaml file into the User data section. Ensure that the check box User data has already been base64 encoded is not enabled.
- Proceed with step 10 and finish the rest of the installation as per the vendor documentation.
- Jump to Deployment Status for next steps.
Deployment Status
Once you have deployed your NTA you can view the deployment steps and status within the SamurAI Portal.
Login to the SamurAI Portal
Click Telemetry and select Network Traffic Analyzer from the main menu
Click the relevant NTA from the presented list
Under General the Status will display as Provisioning.
Deployment Status will be displayed and along with phases and a timestamp. As the NTA builds the status will be listed and cycle green as completed. This includes:
| No. | Deployment Status Message | Description |
|---|
| 1. | Initial call to backend. Network connectivity ok | First message sent to NTA SamurAI backend, this indicates that the enrolment has started |
| 2. | Refreshing OS package lists | Refreshing operating system software repository information |
| 3. | Upgrading packages | Starting updating operating system |
| 4. | Finished upgrading packages | Operating sytem update completed |
| 5. | Base OS update completed | Post operating system update maintenance jobs completed |
| 6. | Initiating CTS Build X | NTA installer downloaded and started |
| 7. | Running verification to ensure minimal requirements | Installer started self check to verify minimum requirements and software settings |
| 8. | Completed verification to ensure minimal requirements | Self check completed |
| 9. | Request device_id | Requesting device identity |
| 10. | Request init | Started the registration process |
| 11. | Initiator successfully contacted backend | Contacting backend to retreive basic operating information |
| 12. | Downloading configuration | Downloaded configuration |
| 13. | Logged in to dockerhub | Authorized to Docker hub to access private containers |
| 14. | Downloading Docker containers | Containers was downloaded from Docker hub and are ready to be used |
| 15. | Storing device configuration to the backend | Sent device information to the backend |
| 16. | Starting Manager | Starting NTA manager software, more software/containers will be downloaded in the background |
The deployment log is saved and available, on the right hand side of the NTA Details, click on

(more options) and select
Deployment Logs.
If you run into any errors, check your deployment and if errors persist
submit a ticket with the SamurAI SOC.
- Once the NTA has completed deployment, Status will display as Not Healthy as individual components need to start. Once complete the Status will be updated to Healthy which may take approximately 5 minutes.
Refer to
Current Status for additional information on the metrics displayed.
Once you have deployed your NTA you will need to determine the Monitoring interface.
Login to the SamurAI Portal
Click Telemetry and select Network Traffic Analyzer from the main menu
Click the relevant NTA from the presented list
Select System Information and view Network which will display the Management and Monitoring interfaces. Take note of each MAC address and ensure it aligns with the relevant configuration for your hypervisor or AWS EC2 configuration.
You will now need to configure traffic mirroring to the monitoring interface of the NTA. Based on your chosen deployment. We advise you to refer to vendor documentation for traffic mirroring as environments may differ. We have provided some useful links based on your deployment model:
VMware VSphere
Microsoft Hyper-V
The following Microsoft documentation is based on Microsoft Defender for IoT, however is applicable to traffic mirroring configuration in general.
Amazon EC2
Delete an NTA
If you delete an NTA it cannot be reversed!
If you need to delete an NTA you can do so by following the steps below:
From the SamurAI Portal click Telemetry and select Network Traffic Analyzer from the main menu
Select the relevant NTA from your list
On the left hand side of the relevant NTA, click on (more options) and select Delete NTA
The following warning will appear: ‘Warning: This is a destructive action and cannot be reversed.’. To ensure you intended to delete the NTA you will need to type DELETE in the field and select Delete NTA
What’s Next?
You have now deployed and configured your NTA. Refer to NTA Details.
4.4.3 - NTA Details
In this article all elements of the Network Traffic Analyzer are outlined to help you understand the panels available.
List all NTAs
Login to the SamurAI Portal
Click Telemetry and select Network Traffic Analyzer from the main menu
A list of all NTAs will be displayed. Various fields are displayed based on information you included when creating the NTA.
Click on an entry to drill into an NTA’s details.
General
The General panel of an NTA provides an overview of the NTA and status.
| Field | Description |
|---|
| Status | Status of the NTA. See NTA status for list of potential statuses |
| Description | A decription field for your NTA. You can edit this field at any time |
| Location | Populated from Location specified during creation of the NTA |
| Hostname | Hostname specified during creation of the NTA |
| Size | The size selected during creation of the NTA |
NTA Status
| Indicator | Status | Description |
|---|
| Pending | NTA components installing / provisioning or awaiting status |
| Unknown | The SamurAI platform is unable to determine a status |
| OK | Healthy |
| Warning | Warning status will be displayed if the NTA is experiencing any issues e.g components are experiencing problems |
| Critical | Critical status will be displayed and an email notification will be sent to registered users if the SamurAI platform cannot communicate with the NTA |
Current Status
The Current Status widget provides a visual representation of the CPU, Memory and Disk usage of the NTA. Each metric is displayed as a half-donut chart, offering a quick visual snapshot of system load.
| Metric | Description |
|---|
| CPU Utilization | Displays the percentage utilization across all CPU cores. |
| Memory Utilization | Displays the percentage of system memory consumed. |
| Disk Utilization / | Represents the percentage of storage space used for the system disk. |
| Disk Utilization /srv | Represents the percentage of storage space used for the data disk. Monitoring this metric ensures sufficient space for data/memory cache |
The above metrics are updated in the SamurAI Portal every 5 minutes and are monitored by the SamurAI platform. It is important to note that it is normal to observe high utilization of all metrics as the NTA performs continuous resource intensive inspection of mirrored traffic with processes that inherently demand significant resources to maintain performance and accuracy. For deeper insight we recommend reviewing the additional performance metrics plotted as time-series graphs found under
NTA details.
This widget may also include status messages of individual components of the NTA, this will assist with identifing any problems and should be included if you submit a ticket with the SamurAI SOC.
NTA Email Notifications
The SamurAI platform will send email notifications to registered users should your NTA status change to Critical. Once any issues have been resolved, you will also be notified again when rectified. Users have the option to enable or disable notifications.
Enable or Disable Email Notifications
- From the NTA Table view, click on More Options () to the right of the NTA View
- Select Notifications Settings
- Toggle the setting to enable or disable by selecting the relevant icon per listed NTA. Alternatively you can select the default setting (send notification).
- Click Save.
You can also achieve this per individual NTA by:
- From the NTA Table view, click on More Options () to the left of the NTA.
- Select Notifications
- Toggle the setting to enable or disable by selecting the relevant icon. Alternatively you can select the default setting (send notification).
- Click Save.
If your NTA is being proivisioned or has been restarted, the NTA may cycle through multiple status updates, this is not cause for alarm as this typically occurs for a short period of time as processes restart. Once complete your NTA status will be displayed as OK.
The System Informatiom panel displays important NTA system information and metrics including:
System
| Field | Description |
|---|
| Operating System | The NTA leverages Ubuntu, it is our repsonsibility to maintain the Operating System. |
| CPU | CPU information captured |
| Cores | No. of physical and logical cores of the NTA |
| Memory | Total memory of the NTA |
| Swap | Allocated disk space used as virtual memory |
Storage
| Field | Description |
|---|
| Mount | Directory where storage device or parition is attached to the file system |
| Device | Represents the virtual storage medium by path or Amazon EBS volume |
| Size | Capacity of storage device or partition |
| Usage | Amount of storage consumed in % |
Network Management
| Field | Description |
|---|
| Configuration | Static or DHCP |
| IPv4 | The assigned IP address. The Monitoring interface will not have an IP address |
| Proxy server | Proxy server configured during cofiguration creation |
| NTP servers | Network time protocol servers configured during configuration creation |
| Interface | Virtual adapter |
| Type | Management interface |
| MAC | Unique identifier assigned to the interface |
| Current Bandwidth | The data transfer rate of the network interface measured in Mbit/s |
Network Monitoring
| Field | Description |
|---|
| Interface | Virtual adapter |
| Type | Monitoring interface |
| MAC | Unique identifier assigned to the interface |
| Current Bandwidth | The data transfer rate of the network interface measured in Mbit/s |
Metrics
All metrics displayed are by default over the past 2 hours however you can adjust via the Time Picker
| Metric | Description |
|---|
| CPU Utilization | Displays the percentage utilization across all CPU cores. High usage may indicate heavy traffic analysis or potential system strain |
| Memory Utilization | Displays the percentage of system memory consumed. Persistent high usage could impact performance and may require optimization |
| Disk Utilization | Represents the percentage of storage space used across each disk mount. Monitoring this metric ensures sufficient space for traffic data and system operations |
| Bandwidth Utilization | Displays bandwidth utilization of the mirror interface in Mbit/s |
Alerts
The Alerts panel displays security detections made by the NTA.
You do not have to act on any alerts as the SamurAI SOC analysts triage, investigate and validate alerts as part of the Managed Detection & Response (MDR) service.
As alerts are validated by the SamurAI SOC analysts and investigated, they may potentially lead to a reported Security Incident and are marked accordingly. Our strategy includes visibility and transparency of the service we provide to you therefore this feature provides you that visibility showcasing the value of the NTA and service.
Alerts Summary
Alerts are summarized in a panel which can be updated based on a specified time period and includes:
- Security Incidents - the total number of security incidents reported to you that may correspond to one or more alerts.
- Alerts - the total number of alerts detected by the NTA.
- Real-time engine- the total number of alerts created by the NTA resident SamurAI real-time engine.
- Vendor - the total number of alerts created by the NTA resident Intrusion Detection System (IDS) - Suricata.
Filters
Various filters are available to determine the alerts to be displayed.

Figure 1: Time and Display filter
The total number of alerts within the alerts table in displayed to the left of the Time Period filter.
Time period
You can update all panels to specific date and time ranges. We default to the Last 24 hours however have included Quick time ranges.

Figure 2: Date and time selection
Display Filter
Enter any values you wish to filter and highlight within the display filter.

Figure 3: Display filter
Alert Column Filter
Adjust and show/hide any of the column values within the Alert Table.

Figure 4: Alert column filter
Alerts Table
All alerts related to the NTA are listed within the alert table, it is important to note is that the table is limited to 10,000 alerts therefore apply filters to narrow the results.
For description of each field within the Alert table refer to Alerts Table
4.5 - SamurAI Endpoint Agent
What is the SamurAI Endpoint Agent?
The SamurAI Endpoint Agent is a light weight, software component installed on an endpoint (such as a workstation or server) providing deep visibility and enabling SamurAI Managed Detection and Response across your endpoints. Capabilities include:
Telemetry Data Collection
- Standardized and targeted telemetry data collection independent of operating system (e.g the agent utilizes a custom Sysmon configuration, specifically tuned for the SamurAI Platform applied to Microsoft Windows to optimize event collection and analysis).
- Eliminates the need for 3rd party integrations to the SamurAI Platform (e.g winlogbeat agents installed on the Microsoft Windows OS).
- Eliminates the need for any endpoint configuration in telemetry collection.
Detection
- Leverages the SamurAI Real-Time Engine for detection of threats.
- We apply our global threat intelligence feeds to enrich data with context about known malicious actors, emerging threats, and attack patterns enhancing accuracy and speed of threat detection.
- Leverages the SamurAI Hunting Engine for automated and analyst driven threat hunting.
Investigate
- Provides a powerful query capability (osquery) with real-time visibility into endpoints (e.g query for installed browser extensions to help analysts detect potential persistance mechanisms used by threat actors and accelerate investigations).
- Event driven threat hunting to investigate, validate and contextualize a threat/incident.
Respond
- Provides incident response tooling and aids endpoint forensics.
What’s Next?
Review the SamurAI Endpoint Agent Support and Pre-requisites.
4.5.1 - Support and Pre-requisites
Listed below are supported Operating Systems (OS) and communication pre-requisites. If you do not see a specific OS version listed please reach out to us.
Supported Operating Systems
| Operating System | Supported Version |
|---|
| Microsoft Windows | - 10
- 11
- Server 2016, 2019, 2022, 2025
|
Linux and MacOS SamurAI Endpoint Agents are available in Beta, however you must request access by raising a ticket.
Communication Pre-Requisites
Ensure endpoints with the SamurAI Endpoint Agent installed have the following network connectivity:
| Source | Destination | Ports | Description |
|---|
| SamurAI Endpoint Agent | spiral-node-api.td.nttsecurity.io | TCP/443 | - Telemetry ingestion
- Status
- Queries
- Updates
|
What’s Next?
Now you have an understanding of support and pre-requisites, learn about Download and Installation.
4.5.2 - Download and Installation
Before you begin download and installation of the SamurAI Endpoint Agent you must first select how you wish to manage SamurAI Endpoint Agent Updates and decide settings for the SamurAI Endpoint Agent for Windows.
- From the SamurAI Portal select Telemetry and click SamurAI Endpoint Agent
Upon first navigation to this page, the following will be displayed:

Figure 1: SamurAI Endpoint Agent settings
Updates
Select how you want to manage SamurAI Endpoint Agent updates:
- Auto Managed : Auto updates of agents is enabled by default, this option will automatically update agents as new versions are released without any action needed on your part.
- Self Managed : Select this option should you wish to manage updates yourself. See Self Managed for more information.
You can change this at any time. Refer to
Settings.
SamurAI Endpoint Agent for Windows
- Determine whether to Accept Microsoft Sysinternals Software Licence Terms (Sysmon EULA).
We recommended accepting the Sysmon EULA as this enables advanced endpoint telemetry and provides deeper visibility for threat detection and investigations. Refer to
The SamurAI Endpoint Agent and SysmonIf you accept the Sysmon EULA, you can select to Install Sysmon if missing
Click Apply SamurAI Endpoint Agent Settings
The SamurAI Endpoint Agent and Sysmon
For enhanced telemetry on Windows, the SamurAI Endpoint Agent optionally leverages Microsoft System Monitor (Sysmon), a vital component for collecting detailed process and system activity. Read more about Sysmon from Microsoft Documentation.
Sysmon is not bundled with the SamurAI Endpoint Agent therefore if you Accept Microsoft Sysinternals Software Licence Terms (Sysmon EULA) upon installation of the SamurAI Endpoint Agent, sysmon will be downloaded and installed or updated silently using standard Microsoft provided installation flags.
The SamurAI Endpoint Agent leverages a custom Sysmon configuration tuned and maintained by the SamurAI detection engineering team. This provides:
Noise reduction: a default Sysmon deployment generates an extremely high volume of data, our tuned configuration filters out unnecessary events which are irrelevant for SamurAI Managed Detection and Response.
High Fidelity detections: we selectively enable and enrich valuable event IDs (e.g process creation, network connections, registry modification etc) aligned with the MITRE ATT&CK framework.
Consistency across environments: ensures standardized event coverage across deployments.
Ongoing Tuning: we regularly update the configuration to reflect emerging attacker techniques, new ATT&CK mappings and lessons learned.
What’s Next
You can now proceed to Agent Download
4.5.2.1 - Download
To download the SamurAI Endpoint Agent follow the steps below:
Login go the SamurAI Portal
Click Telemetry and select SamurAI Endpoint Agent from the main menu
Click Installers
Select the relevant installer based on your operating system and click Download
When you download the SamurAI Endpoint Agent, you may notice use of the name Spiral. This is expected and an internal identifier used by the system.
The installer includes a checksum to verify the package.
Verify Download
Microsoft Windows
To ensure your download has not been corrupted or tampered with, you can validate it’s checksum using the built-in Windows tool ‘certutil’.
Run the following command and view the checksum to ensure it matches the installer within the SamurAI Portal:
c:\certutil -hashfile spiral-windows-amd64.msi sha256
example:
c:\certutil -hashfile spiral-windows-amd64.msi sha256
SHA256 hash of spiral-windows-amd64.msi:
85193aa8c4e7a1eaba1da36251bc6ea78e0e62b2
CertUtil: -hashfile command completed successfully.
What’s Next?
Based on your Operating System jump to the relevant SamurAI Endpoint Agent installation guide:
4.5.2.2 - Microsoft Windows
Deploy the SamurAI Endpoint Agent using your organization’s software distribution tools e.g Group Policy (GPO) active directory environment or Microsoft Intune.
When you install the SamurAI Endpoint Agent, you may notice installed components use the name Spiral - for example, the Windows installation path C:\Program Files\Spiral. These are expected internal identifiers used by the system.
Manual Installation
Locate the Windows MSI installer file that you previously downloaded and double-click, a small progress window will appear which does not require any interaction.
Additional commands are available using the command line as outlined below. All commands can be used in combination as required.
Proxy Support
If your organization leverages a proxy then use the following command during install:
Example:
msiexec.exe /i "spiral-windows-amd64.msi" PROXY=http://<ip>:<port>
This will create a key in the Windows registry: Computer\HKEY_LOCAL_MACHINE\SOFTWARE\NTT\Spiral with a parameter Proxy with the proxy from the command line.
This can be added/changed/removed at a later time, if so the SamurAI Endpoint Agent services must be restarted.
Quiet Mode Installation
Use the the following command for quiet mode installation (i.e no progress window is displayed):
msiexec.exe /i "spiral-windows-amd64.msi" /qn
Verbose Installation Logs
If you wish to view installation logs you can use the following command to save logs to a file for review:
Example:
msiexec.exe /i "spiral-windows-amd64.msi" /L*vx output.txt
Validate installation
After the installation has completed, there will be a Spiral entry under installed programs.

Figure 1: Windows apps & features
The installation folder is C:\Program Files\Spiral with full control permissions to SYSTEM and Administrators.
This should apply to all subfolders and files with one exception osquery.db which will have an additional read access to Everyone/World.

Figure 2: SamurAI Endpoint Agent Windows install path and files
There will also be a service named Spiral running.

Figure 3: Task manager service
The Spiral process will also be visible.

Figure 4: Task manager process
Additionally osquery processes will be running.

Figure 5: osquery processes
The following files are created by the installer:
C:\Program Files\Spiral\bin\spiral.exe: The Spiral launcher (more details what it does and functions further down)
C:\Program Files\Spiral\bin\osqueryd.exe: The Osqueryd binary that will be launched by spiral.exe (more details further down)
C:\Program Files\Spiral\config.yaml: The configuration for Spiral launcher
C:\Program Files\Spiral\secret: The embedded tenant/enrollment secret
C:\Program Files\Spiral\ca.pem: Spiral CA bundle used to communicate with the SamurAI platform. Will download new if missing or if outdated. Used by both spiral.exe and osqueryd.exe.
The following files are created by either the Spiral or Osquery process:
C:\Program Files\Spiral\server.crt: Exported server certificate chain from Spiral Node API (typically excluding Root CA).
C:\Program Files\Spiral\sysmon.xml: The sysmon configuration downloaded from Spiral Node API.
C:\Program Files\Spiral\data\osquery.db: RocksDB data folder used by Osquery for state keeping. Osquery sets this with read access to Everyone/World at intervals.
C:\Program Files\Spiral\data\extensions.load: Purposely left empty
C:\Program Files\Spiral\data\osquery.flags: Osquery startup flags (generated by Spiral), extended configuration is fetched by Osquery over HTTPS.
C:\Program Files\Spiral\data\osquery.log: Stdout/stderr log output from osqueryd.exe
C:\Program Files\Spiral\data\osquery.pid: Osquery PID
C:\Program Files\Spiral\data\osquery.uuid: UUID for this specific node
C:\Program Files\Spiral\data\spiral.log: Stdout/stderr log output from spiral.exe
C:\Program Files\Spiral\data\shell: A folder created if running spiral.exe with "shell" command which is an interactive mode to run Osquery commands.
Dependant on your selection for SamurAI Endpoint Agent for Windows the agent may:
- Download Sysmon from Microsoft official servers.
- Install or update Sysmon silently using standard Microsoft provided installation flags.
- Modify Sysmon with the configuration.
Review Deployed SamurAI Endpoint Agents
Review and Manage within the SamurAI Portal.
4.5.3 - Management
SamurAI Endpoint Agents registered with the SamurAI Platform are referred to as Nodes within the SamurAI Portal.
View Nodes
To view all deployed agents:
Login go the SamurAI Portal
Click Telemetry and select SamurAI Endpoint Agent from the main menu.
Dashboard
The dashboard panel displays summary information:
- Nodes: the total deployed and seen by the SamurAI platform
- Online: the total currently online (have communicated with the SamurAI platform within five minutes)
- Offline: the total number offline (have not communicated with the SamurAI platform for five minutes)
- Platforms: the total number of platforms i.e Windows / MacOS / Linux
Nodes Table
A table displays all deployed agents with node specific information:
| Field | Description |
|---|
| ID | Universally Unique Identifier (UUID) of the node |
| Status Description | Status of the agent. Potential status displayed: Online or Offline |
| Name | Hostname of the endpoint |
| Platform | Platform and architecture - icon depicting OS and processor e.g AMD64 |
| OS Name | The underlying operating system |
| OS Version | The operating system version |
| Agent Version | The SamurAI Endpoint Agent version installed |
| Sysmon Version | The System Monitor (sysmon) version installed |
| Last external IP | The external IP address of the agent as seen by the SamurAI platform |
| Last Seen | Date and timestamp of when the agent last checked-in to the SamurAI platform |
| Inactivity Threshold | An indicator displaying time until the agent will be deemed inactive and purged from view |
Inactive Node(s)
Nodes communicate with the SamurAI platform every minute and are marked offline if no communication is received after five minutes.
Offline nodes will be visible for 90 days, after this threshold it is deemed to be inactive and purged from the SamurAI platform backend and the current view.
You can view inactive and deleted nodes within the Node History.
Delete Node(s)
You can delete nodes from the table:
- Select the nodes you wish to Delete
- Click Actions and select Delete selected nodes
- To ensure you intended to delete the agents you will need to type DELETE in the field and select Delete
- The deleted node record will appear under Node History.
If a node has been deleted and you have not un-installed the agent from the endpoint and it starts communicating with the SamurAI Platform, it will be displayed within the Node Table, however will remain within Node History.
Node History
The Node History log displays a table of Deleted Nodes and Purged (deemed inactive) with node specific information:
| Field | Description |
|---|
| ID | Universally Unique Identifier (UUID) of the node |
| Action | The action taken against the node. This could include Purged based on the inactivity threshold or Deleted |
| Name | Hostname of the endpoint |
| Last Status | The Last known Status of the node (typically offline) |
| OS Name | The underlying operating system |
| User | The user that deleted the node. This could also include System which denotes the SamurAI platform when the node is inactive and purged |
| Last Enrolled | Date and timestamp of when the node was originally enrolled |
| Action Applied | Displays when the Action was applied to the node |
Node history is stored and visible following our standard retention of 400 days.
4.5.3.1 - Settings and Updates
Settings
You can change the Update and Sysmon EULA selections by clicking Settings from the SamurAI Endpoint Agent view.
- Auto Managed : Auto updates of agents is enabled by default, select this option if you want the agent updates to occur automatically without any action needed on your part.
- Self Managed : Select this option should you wish to manage agent updates yourself.
For Sysmon EULA settings we recommend maintaining your original selection to ensure consistency across your nodes.
Updates
Self Managed
If Self Managed is selected a new option entitled Update Tasks is displayed.
Update Tasks
Selecting Update Tasks allows you to configure tasks for updating your deployed agents.
- Click on Create Update Task
Within the Create Update Task view we recommend that you use filters and save as views. This is useful if, for example you want to run an update task against a specific set of deployed agents. Click Views to save/reset/delete your different filters. Once saved you can toggle between views.
Enter a Name for the task e.g Windows 10 Pro Update
Toggle whether you wish to Start immediately. If you do not start the task immediately you have the option to update the status at a later date/time. See Update the Task.
Select whether you wish to update:
- SamurAI Agent version (the latest version will always be displayed)
- Sysmon version
Rate Limit is enabled by default to 5 nodes per 1 minute. Read more about Rate Limiting
Once complete, select Review Selection and review your tasks
Click on Create Update Task
Rate Limiting
Rate limiting allows you to roll out updates to nodes gradually instead of updating all at once. This controlled approach reduces risk of disruption, avoids overloading networks and ensures that if an unexpected issue occurs, only a small number of nodes are affected.
Rate limiting allows you to configure the number of nodes to update per time duration (which can be set per minute/hour/day).
When rate limiting is recommended:
- Large fleets (typically 500+ nodes)
- Networks with remote sites, VPN’s or limited bandwidth
- Critical workloads where uptime and stability are essential
- Major agent version upgrades or significant configuration changes
When rate limiting may not be necessary:
- Small fleets with a few hundred nodes
- Minor, low-risk updates
Rate limit upper limits are set as:
- 25 nodes per 1 minute, 50 nodes per 2 minutes etc
- 1500 nodes per 1 hours, 3000 nodes per 2 hours etc
- 36000 nodes per 1 day, 72000 nodes per 2 days etc
View Update Tasks
- From the SSamurAI Endpoint Agent view, click Update Tasks.
A table displays all Update Tasks with specific information:
| Field | Description |
|---|
| Status | Status of the Update Task (hover over for text, potential status displayed Paused/Running/Completed/Failed |
| Status Description | Status Description (potential status displayed Paused/Running/Completed/Failed |
| Name | Name provided for the task |
| Sysmon Version | Updated Sysmon version (if applicable) |
| Agent Version | Updated SamurAI Endpoint Agent version |
| Target Node Count | The number of nodes within the update task |
| Completed Node Count | The number of completed node updates |
| Failed Node Count | The number of failed node updates |
| Created | Date/Timestamp of update task creation |
| Updated | Date/Timestamp of updates to the update task |
Select an Update Task from the list to display status of individual node updates.
A summary will be displayed including:
- Update task status
- Number completed
- Number failed
- Target
- Rate Limit
Additional details for each node are also included:
| Field | Description |
|---|
| Name | Hostname of the node to be updated |
| Node Update Task Status | The status of the node update, potential status are New/Pending/Completed/Failed |
| Message | A short description of progress |
| Start Date | Date/Timestamp of agent update |
| End Date | Date/Timestamp of agent update end |
| Agent before | SamurAI Endpoint Agent version before the update |
| Agent after | SamurAI Endpoint Agent version after the update |
| Sysmon before | Sysmon version before update |
| Sysmon after | Sysmon version after update |
Update the Task
You can update the State of an Update Task to either Paused or Running.
For example, if you previously set an Update Task NOT to Start Immediately you can set the state to Running to begin the update:
From the Update Tasks list select the relevant Update Task
Select More Options ( ).
).
Click Update the Task
Select the State to Paused to pause the update task or to Running to begin or resume the update task.
4.5.4 - Uninstall
You may notice installed components use the name Spiral - for example, the Windows installation path C:\Program Files\Spiral. These are expected internal identifiers used by the system.
Follow the steps to uninstall the SamurAI Endpoint Agent based on your Operating System:
Microsoft Windows
Uninstall the SamurAI Endpoint Agent using your organization’s software tools e.g Group Policy (GPO) active directory environment or Microsoft Intune.
Go to Add or remove programs
Find Spiral Agent
Click Uninstall
When uninstalled, program files and registry entries are removed from the endpoint/node, however some files may remain:
- All files not added by the installer itself such as the Data folder in C:\Program Files\Spiral\Data
- Files server.crt and sysmon.xml in C:\Program Files\Spiral remain after uninstall.
It is safe to delete C:\Program Files\Spiral after the uninstall has completed.
The SamurAI Endpoint Agent installer does not include Sysmon, and will not be uninstalled. If you wish to uninstall sysmon please refer to
Microsoft Documentation4.5.5 - FAQ
General
Is the SamurAI Endpoint Agent available to all clients?
Yes, the SamurAI Endpoint Agent is available to all SamurAI Managed Detection & Response (MDR) clients.
Is the SamurAI Endpoint Agent an Endpoint Detection & Response (EDR) product?
No, despite having similar capabilities to commercial EDR solutions it is not intended as a replacement. The intent is for a SamurAI platform native agent, allowing full customization, built and configured in support of SamurAI Managed Detection & Response (MDR) and Incident Response engagements.
I already have an EDR (e.g Crowdstrike, Microsoft Defender), do I need the SamurAI Endpoint Agent?
The SamurAI Endpoint Agent is optional, however there are advantages to its use such as the ability to gather advanced data and metrics optimized specifically for the SamurAI platform and detection engines in addition to aiding our SOC analysts to investigate and validate threats.
Can I use the SamurAI Endpoint Agent in conjunction with my current EDR?
Yes, the SamurAI Endpoint Agent can run in conjunction with your existing EDR solution for maximum visibility and response.
Are there any known limitations or problems with running the SamurAI Endpoint Agent in addition to my deployed agents?
The SamurAI Endpoint Agent has been tested alongside other agents e.g EDR solutions, and no limitations or problems were identified. In some cases you may need to 'whitelist' the SamurAI Endpoint Agent on your existing EDR deployments to ensure no issues. As the SamurAI Endpoint Agent is lightweight with a low footprint, resource contention is unlikely but is highly dependant on the underlying endpoint and network connectivity.
There is a potential for duplicate security alerts, however the SamurAI platform handles this.
What type of data does the SamurAI Endpoint Agent collect from the host?
This is dependant on the underlying operating system, however for Microsoft Windows we gather event data using System Monitor (Sysmon) which is part of the Sysinternals Suite developed by Microsoft (if you have accepted the Microsoft UELA see
SamurAI Endpoint Agent for Windows for additional information).
We leverage a custom Sysmon configuration (which we maintain) that collects detailed information about system activity (logged to the Windows Event Log) to help with security monitoring and investigations.
The SamurAI Endpoint Agent also leverages osquery which allows the SamurAI platform / SOC to query the endpoint operating system as if it were a relational database, for example gather system information (hostname,OS version, uptime), user and login activity, processes and services, networking (active network connections, listening ports).
What is the average log data volume per day for the SamurAI Endpoint Agent?
This can vary depending on the type of endpoint and activity however typically 30MB per day but can go up to approximately 200MB per day.
Support
What Operating Systems are supported?
Can the agent also be used and installed on server systems (e.g Windows Server 202x)
Can the SamurAI Endpoint Agent be installed on virtual systems? e.g within a virtualization platform where multiple virtual machines (VMs) share the same underlying hardware?)
Yes, however please adhere to supported operating systems. Please review
Support and Pre-requisites for a current list of supported operating systems
Installation and Setup
What network connectivity is required?
What endpoints should I install the SamurAI Endpoint Agent on?
Ideally all endpoints – laptops, servers. Alternatively you can install the SamurAI Endpoint Agent on specific endpoints where you have limited or no EDR coverage.
Are there any restrictions on installing on a user’s PC/endpoint?
There are no restrictions on installation other than supported OS and connectivity requirements.
Is it possible to install the SamurAI Endpoint Agent remotely?
It is your responsibility to deploy the SamurAI Endpoint Agent after download from the SamurAI portal. We recommend deploying the SamurAI Endpoint Agent using your organization's preferred software distribution tools.
For Windows environments, this may include Group Policy Objects (GPO) in an Active Directory domain or Microsoft Intune for cloud-based management.
Management
How often are SamurAI Endpoint Agents updates available?
We periodically make SamurAI Endpoint Agent software updates as needed to ensure the latest enhancements are available. We keep you updated via announcements in the SamurAI Portal and the latest
Release Notes.How do I update deployed SamurAI Endpoint Agents?
You can update automatically or choose how and when to update deployed SamurAI Endpoint Agents. Please review
Agent Updates.Why is the term Node(s) used in the SamurAI Portal?
A Node is a registered instance of an Endpoint with the SamurAI Endpoint Agent installed. Please review the
SamurAI Glossary of Terms.Why is the name Spiral used in folder paths and services names?
The SamurAI Endpoint Agent operates under the name Spiral, which are expected internal identifiers by the SamurAI platform.
5 - Analysis
5.1 - Advanced Query
Advanced Query provides a powerful interface that enables you to query your event data ingested into the SamurAI platform. For instance, you can query for matching events which were logged or triggered in the past in order to fully understand the context.
After a threat has been responded to, Advanced Query can also play an important role in the forensic investigation of the threat, in order to determine both its extent and the sequence of events which occurred.
Advanced Query provides a very flexible interface which is based on Microsoft’s Kusto Query Language (KQL). This means that you can perform tasks ranging from simplistic queries all the way through to complex and powerful threat hunts in search of evasive threats.
The Advanced Query interface provides you with a graphical view showing the distribution of query matches over time. This allows you to easily spot deviations from the norm, and to identify the time when important events occurred.

Some examples of the functionality provided by Advanced Query include:
- Ability to use the KQL query language to cover simplistic searches across your data to running complex queries in support of Threat Hunting activities.
- Ability to query the SamurAI data lake for events over the entirety of your full retention period.
- Ability to provide a time-based visualization of the results matching your query enabling you to spot deviations from normal activity.
- Ability to easily filter in/filter out values.
- Ability to easily drill in and out using a graph of the overview, enabling you to quickly pivot across anything from small result sets, to ones containing millions of data points.
- Ability to query over a user-defined time period.
- Ability to easily search/filter the results and export the selected results.
Some example use cases, which can be covered by Advanced Query include:
- Verifying activity of an endpoint over a specified time period
- Tracking lateral movement of a threat actor
- Finding other endpoints which may have been affected by a breach
- Tracing the sequence of events in a breach
- Find all activity related to a specific attacker
- Confirming that new log sources are generating data and verify these are configured correctly.
The Advanced Query user interface is divided into a number of panes which provide:
- A time-picker allowing the user to easily select a time-period to apply a query.
- An interactive KQL query editor.
- A filters panel, reflecting all the Fields available in the current result. This allows you to quickly filter in/out, search across the filter values and visually see the split between various values. This also allows you to quickly narrow down a query.
- A Results panel, showing all matching Alert and Event data, both in parsed and raw format. This allows you to easily search and filter cross the viewed result and export results of relevance.
- A User Tips panel, showing some quick Tips to assist the user in getting started in writing their first KQL queries.
To learn all about the feature within the SamurAI Portal please review Advanced Query Functionality.
5.1.1 - Advanced Query Functionality
Advanced Query allows you to query all of your telemetry data ingested into the SamurAI platform using Microsoft’s Kusto Query Language (KQL). You can use KQL to perform simple exploration of your data through to sophisticated threat hunting in search of security anomalies and evasive cyber security threats.
In this article we provide an overview of each element of the interface within the SamurAI Portal and its’s usage to enable you to maximize your query results.
Navigate to the Advanced Query Interface
- Login to the SamurAI Portal
- Click Analysis and select Advanced Query located on the main menu

Figure 1: Advanced Query interface
Advanced Query Panels
Query Panel
The Query panel is where you write KQL queries. As you construct a query the interface auto-completes suggesting operators or schema.

Figure 2: Query panel auto-complete example
Result Limit
You can choose to display 2000 or 10000 results based on your query by leveraging the drop down.

Figure 3: Result Limit
Click
KQL quick reference for a list of operators/functions and their descriptions. You can also access our Tips by selecting the information icon (

).

Figure 4: Advanced query Tips
Once you have completed writing your query click Run Query

Figure 5: Run Query
Time Period
Any query you run is based on a time period. Select a relevant time period when constructing a query to display results based on this time period.
If you use a timestamp operator within a query, the Time Period will be overridden and be viewed as ’Set in Query’.

Figure 6: Time period
Query History
To view your historical queries click ( ). This displays the latest 50 queries executed by you with time of execution and an option to add the query to a library. To save the query to a library, click (
 ) .For more information on saving a query jump to Save New Query.

Figure 7: Query history
Query Library
A library is where queries are saved for future use. There are different types of query libraries:
- Standard library - useful queries provided and populated by NTT.
- Organization library - queries saved within folders are available to any of your organization’s users with access to the SamurAI Portal.
- My library - queries saved within folders are only available to you.

Figure 8: Query library
Within ‘Organization library’ and ‘My library’ you can create folders to categorize and save your queries.
Save New Query
Click Add to save a query and select the Folder to save it in (you can also create a new folder here). You can optionally add a Description and MITRE ATT&CK category from the prepopulated list.
Once complete click Save.

Figure 9: New query
Edit/Duplicate/Delete Queries
Click more options ( ) if you need to edit or duplicate existing queries to refine them or alternatively delete.

Figure 10: Edit, duplicate and delete options
Editing or deleting queries in the ‘Organization Library’ will be seen by all users of your organization so be careful to ensure queries are not lost.
Fields Panel
The Fields panel displays all fields available based on the query. By default we query the events table which displays all fields available from your telemetry, this is divided into Favorite Fields and Other Fields.
Apply a filter to the fields by typing in the Filter window.
Each Field displays a count which represents the hits within the entirety of the query result.

Figure 11: Fields and count
By selecting a Field you can expand on the values within that field. For example, the graphic below highlights the ‘dest_ip’ field which displays all values with a Count and percentage of total

Figure 12: Field selection showing values
SamurAI has default Favorite Fields, however you can update your Favorite Fields by selecting the Field and either select or deselect as a favorite by clicking  .
.
SamurAI prioritizes processing of Favorite Fields over Other Fields to optimize results and improve efficiency. Therefore activating ‘Favorite’ on a field will result in the data collection and count being prioritized and returned faster. Conversely, deactivating Favorite on Fields may also increase overall performance of the Favorite section.
To simplify query building you have the ability to select one or more values when you expand the field using the “+ - " symbols, this appends the value to include (==) or exclude (!=) from the query.

Figure 13: Add value to query
Based on the field you also have the ability to search and check the value against
VirusTotal and/or
AbuseIPDB (Click on the links to learn more). You can check public IP addresses against both databases or domain/filehash/url against VirusTotal.
Results Overview Panel
Query results are presented in a graphical overview, this may allow you to visually identify patterns or deviations in the results. The graph takes into consideration selected time-period, number of results matching the query and is presented with date/timestamp and total for each bar in the graph. Hovering over any bar in the graph will display the date/timestamp and total results.

Figure 14: Graphical result overview
Due to the way we process your telemetry, if your query includes the current time period there may be a slight delay in event data displayed in your results.
The graph is also interactive, by clicking on any bar in the graph or by left click selection and highlighting multiple bars, the Fields and Results Panel are adjusted to display data in the selected time-period. You can also zoom in to specific results by selecting Zoom to Selection ( )
)

Figure 15: Result selection
Additionally you can Zoom out ( ) from any result set to view a larger time-period in relation to the active result. The Zoom out increment is based on the time period between the first result and last result and added to the ‘from’ and ’to’ time.
For example: First result at 13:00 and Last result at 14:00, is a 1 hour time difference. If you Zoom out this adjusts the time period 1 hour, therefore , 13:00, updates to 12:00 and 14:00 adjusts to15:00. Increasing the viewed time-period from 1 hour, to 3 hours.
By default a column chart type is displayed, however you also have the options to select from multiple chart types options, based on the chart type.

Figure 16: Chart types
If you wish to display results in an alternative chart type it is recommended to narrow down and refine your query through time period, fields and filters as visualizing results in a large data set may cause a ’too many data points’ notification.
Results Panel
The results panel displays an Events view (with timestamp and raw data) or Table view (with all events displayed in rows and each field in columns). The results panel will display up to 2000 or 10000 results dependant on your selection under Result Limit.

Figure 17: Results panel
To optimize user experience and performance SamurAI limits the results panel to a maximum of 10000 results. 10000 results could be a subset of a much larger result set based on your query, in these cases we recommend refining your query by adjusting the time period or adding specific filters - after all you would not want to review results which could potentially be in the 100’s of thousands!
Results Panel Options
By selecting more options () displayed on the top right of the the result panel you can:
- Show favorite fields
- Show empty fields
- Autosize visible columns
- Clear all filters
- Clear all sorting
- Export to CSV - export the results displayed to CSV. This functionality takes into consideration result selections and active filters making it very easy to export specific results.

Figure 18: Results panel options
Expand the Result
You can view all event data in a vertical view by selecting expand ( ) in both Event and Table views.
Filter the Result
You can create filters against any of the results by selecting ( ) and choosing a filter option and parameter.

Figure 19: Filter options
You can also easily filter results from the Filter located at the top right of the Results Panel.
Filter / Copy based on value
By selecting more options () on any given field result you can copy to clipboard ( ) or Add or Exclude filter to your query.

Figure 20: More options
When adding or excluding a specific field result to your query, SamurAI attempts to automatically update the KQL query for you to run again!
What’s Next?
If you are new to KQL please refer to Constructing an Advanced Query or for comprehensive documentation refer to Microsoft KQL documentation.
5.1.2 - Constructing an Advanced Query
The Advanced Query feature within the SamurAI Portal uses Microsoft’s Kusto Query Language (KQL). In this article we discuss the basics of KQL, the logic of a query and provide some examples to get you started.
What is KQL?
In short, KQL is as it states, a Query Language.
The “K” in KQL (Kusto) is named after Jacques Cousteau, the infamous ocean explorer! Just like Jacques’s exploration into the depths of the oceans, finding previously unknown volcanic basins, KQL provides you the ability to explore the expanse of your telemetry data.
Why and when use KQL?
Of course, you are not going to find any volcanic basins or new species of dolphin in your data, however in the cybersecurity context it will allow you to find actionable information. Use of KQL will allow you to investigate your data to answer simple questions such as ‘is my log source generating data’ through to tracing the sequence of events in a breach. You may be familiar with the term Threat Hunting, effectively searching for malicious, suspicious or nefarious activity - whether that be proactive via determining a hypothesis through to hunts based on Indicators of Compromise (IOCs) and Indicators of Attack (IOAs). In essence, using KQL helps you answer the following questions:
- Does X exist
- Where does X exist?
- Why does X exist?
- How to respond?
KQL Logic
A typical query is structured to search, locate information and produce results.
The structure may include:
- What? table to query
- Pipe (|) for command separation
- Filter
- Order data
- Modify Columns in results
Lets walk through some simple examples to understand the logic.
Find events between two hosts
events | where src_ip == "10.170.236.50" and dest_ip == "10.179.236.106"
- The first step in this query outlines what to query, in this example it is the “events” table. By default SamurAI always queries the “events” table.
- The pipe ( | ) command is always used for command separation.
- We then use a ‘where’ operator to filter within the query for the source ip address (src_ip) of “10.170.236.50” and a destination IP address (dst_ip) of “10.179.236.106”
When looking at the results of a query, you will be presented with associated Fields based on the query which allows you to narrow down your search. KQL query statements work like a funnel, starting with a large data set and passing it through multiple operators until it is filtered, summarized or rearranged as required.
By selecting a Favorite Field or Other Field you can start to narrow down your results to your requirements. Alternatively you may choose to include the fields within the query itself or use the Project operator to include specific column fields within your result.
Refer to Advanced Query Functionality to understand more on Favorite Fields and Other Fields.
Search for events with source IP 10.170.236.50 and display a table with a few selected columns
The pipe ( | ) command is always used for command separation
events | where src_ip == "10.170.236.50" | order by timestamp|project timestamp, action, src_ip, src_port, dest_ip, dest_port
- Query the ’events’ table
- Filter events using the where operator for source IP address “10.170.236.50”
- Use the order operator to order results by timestamp
- Use the project operator to include the column fields “timestamp, action, src_ip, src_port, dest_ip, dest_port”
The simple examples above make use of common operators, use the KQL quick reference guide for more info on operators which includes a comprehensive list with definitions.
Complex Examples
Lets now walk through some more complex examples.
Frequency of Events
A common requirement is to find the frequency of occurrence of an event. For instance, in this example we are reviewing Amazon VPC Flow logs and finding which destination IP addresses are receiving the most connections to port numbers below 1024.
events| where product == "Secure Firewall (FTD)" and toint(dest_port) <1024| summarize connections = count() by dest_ip |order by connections
What is also worth noting in this example is that we first need to convert the destination port number to an integer type (as it is a text field) before checking if it is a low-numbered port (less than 1024). For more information on the data types used in the data lake, you can refer to the article on event field data types.
This query produces output which looks something like this:

The result helps us to see which IP addresses are accepting the most connections to privileged ports.
Querying raw logs
Advanced Query isn’t only able to query logs from sources which originate from supported integrations. The fact that logs from any kind of syslog source can be ingested into the SamurAI platform makes it possible to query the raw content of these logs using Advanced Query.
In the example below, we are taking authentication logs from a host, and querying for failed authentication attempts. We are able to use the extend operator and extract function to create our own fields from the log lines, parsing them using regular expressions.
events| where host == "10.1.1.1" and (raw contains "Invalid" or raw contains "fail") and raw !contains "connect"| extend message = substring(raw,16)| extend src_host = extract("([A-Za-z0-9\\-]+).+",1, message)|extend msg_info = extract("\\[[0-9]+\\]\\:(.+)",1, message)| extend app_src = extract("[A-Za-z0-9\\-]+([a-zA-Z0-9\\-]+).+",1, message)| extend user = extract("([A-Za-z0-9\\-]+) from",1, msg_info)| extend src_ip = extract("from([0-9a-f\\.\\:]+)",1, msg_info)| project timestamp, host, src_host, app_src, user, src_ip, msg_info| summarize attempts = count()by src_ip| order by attempts
Once we have extracted the fields we want, we can then go on to perform more operations. In this case we are summarizing the logs by counting the failed authentication attempts by source IP address, and ordering the list so that the IP address with the most failed attempts is listed first. In this case, this helps us to find potential brute force attackers who are trying to guess passwords through brute force tactics.
Tips!
Be Specific when constructing queries!
Used correctly, Advanced Query can perform sophisticated queries matching against a data set measured in terabytes within seconds! However poorly constructed queries can cause problems, cause dreaded browser slowdowns, or even trigger a query time-out when exceeding the maximum allowed query wait time. The more specific you are with your query, the quicker you are able to will get to the Result.
Lets look at an example:
- Try not run a query with no criteria (for example simply ‘events’) against a long timer period. Whilst this might be tempting to view all events, this will match ALL events in your SamurAI tenant, delivering a sub optimal experience - results for such a query could potentially be measured in Gigabytes or at times Terabytes!
Instead, try to be as specific as possible:
- If you are querying activity for a specific source host, add a where statement specifically asking for results from a specific source:
events where src == "172.21.33.99"
events where src == "172.21.33.99" and type == "WEBPROXY"
events | where src == "172.21.33.99" and type == "WEBPROXY" | project timestamp, src, url
- Example:
- matching results: 3 700 000 events
- Approx time to completion: Full Results in 7 seconds
What Now?
As you may have realized from reading this article, Advanced Query is a powerful tool - only limited by your own understanding of KQL and in determining what questions or hypothesis against your data you may have. We recommend you start by writing a few simple queries and review the Microsoft documentation. If you need a reminder of usage in the SamurAI Portal, be sure to review Advanced Query Functionality.
5.1.3 - Event field data types
When using Advanced Query to analyze Events stored in the data lake, it is sometimes necessary to be aware of the data types of the fields of the records being processed.
For instance if you want to perform a numeric comparison on the value of a field, you need to ensure that it has a numerical data type (such as an integer) or otherwise type-cast it first. For instance, in the following example, we are testing for privileged port numbers (below 1024), but the dest_port field is a string:
events| where product == "VPC Flow Logs" and toint(dest_port) < 1024
Here we are using the toint() statement to convert the dest_port field to an integer before making a numerical comparison.
This raises the question of how to determine the data types of fields. You can use the getschema statement to display the data types of fields. The following query will display the types of the fields of the entire schema:
events | getschema
This example produces output something like this:

To find the type of a specific field, you can use the search bar above the output:

This example selects all the fields whose names contain the substring “port”.
If you know the name of the field whose type you want to query, you can use the project statement to filter out only that field:

5.2 - Alerts
What is an alert?
An alert is a security detection made by the SamurAI platform or third party vendor where SamurAI is ingesting telemetry.
How are alerts triggered?
Alerts are triggered by detection engines based on single or multiple events.
The SamurAI Portal displays alerts categorized according to the underlying detection engine. These categories include:
SamurAI platform
- Real-time engine - Proprietary NTT developed detection engine that leverages behaviour modeling, machine learning, and the latest threat research to automatically identify suspected threats during real-time analysis of ingested telemetry into the SamurAI platform.
- Hunting engine - Intelligence-driven detection engine based on the Sigma project but customized by NTT with additional detection capabilities. The SamurAI hunting engine performs automated threat hunting to idenfiy and alert on possible adversary activity.
Vendor
- Alerts generated by and collected from third-party vendor technologies which are integrated with the SamurAI platform (e.g Endpoint Detection & Response (EDR) and Firewall technologies)
What alerts are displayed within the SamurAI Portal?
We display the same alerts as our SamurAI Security Operation Centre (SOC) analysts view.
Do I need to review and act on alerts?
No. The SamurAI SOC analysts triage, investigate and validate alerts as part of your Managed Detection & Response (MDR) service. As alerts are validated by the SamurAI SOC analysts and investigated, they may potentially lead to a reported Security Incident and are marked accordingly.
Our strategy includes visibility and transparency of the service we provide to you therefore this feature provides you that visibility showcasing the value of the service. Refer to the Alert Dashboard which provides some key alert metrics over a given time period.
Next Steps
To further understand Alerts within the SamurAI Portal we recommend you review the Alerts View article.
5.2.1 - Alerts View
In this article, all elements of the Alert View are outlined to help you understand the alerts displayed.
Navigate to Alert View
- Login to the SamurAI Portal
- Click Analysis and select Alerts on the main menu

Figure 1: Alert view example
Alerts Summary
Alerts are summarized in a panel which can be updated based on a specified time period and includes:
- Security Incidents - the total number of security incidents reported to you that may correspond to one or more alerts.
- Alerts - the total number of alerts detected by the SamurAI platform and third party vendor integrated with the SamurAI platform.
- Real-time engine - the total number of alerts detected by the SamurAI real-time engine
- Hunting engine - the total number of alerts detected by the SamurAI hunting engine
- Vendor - the total number of alerts collected from third-party vendor products integrated with the SamurAI platform

Figure 2: Alerts summary example
Filters
Various filters are available to determine the alerts to be displayed.

Figure 3: Time and Display filter
The total number of alerts within the alerts table in displayed to the left of the Time Period filter.
Time period
You can update all panels to specific date and time ranges. We default to the Last 24 hours however have included Quick time ranges.

Figure 4: Date and time selection
Display Filter
Enter any values you wish to filter and highlight within the display filter.

Figure 5: Display filter
Alert Column Filter
Adjust and show/hide any of the column values within the Alert Table.

Figure 6: Alert column filter
Alerts Table
All alerts are listed within the alert table, important to note is that the table is limited to 10,000 alerts therefore apply filters to narrow the results.
What are the Alert table fields?
Review the table below outlining each field displayed:
| Alert field | Description |
|---|
| Timestamp | Local date and time of when the alert was generated displayed in the format [yyyy:mm:dd] [hh:mm:ss], hover over will display Universal Time Coordinated (UTC) and local timezone offset |
| Incident | If the alert is associated with a reported security incident (one or more alerts may be associated with a single security incident) a link to the security incident is displayed |
| Action | Action relates to the parsed action in the underlying event(s) |
| Signature | Signature name from the detecting engine - this could be from an integrated telemetry source (vendor) or from a SamurAI platform detection engine |
| Source | Initiating source, this could be represented as hostname(s), IP address, user or URL |
| Source Port | The initiating source port |
| Destination | The destination, this could be represented as hostname(s), IP address, user or URL |
| Destination Port | Destination port number |
| Protocol | Network protocol e.g TCP / UDP |
| User | User from the underlying event(s) |
| MITRE | The MITRE ATT&CK tactic mapping - this could include one or more tactics. For further information refer to ATT&CK Matrix for Enterprise |
| Detection | The detection engine triggering the alert. Refer to How are alerts triggered? |
| ID | Alert ID (not displayed by default) |
If MULTI is displayed in any of the fields it denotes multiple entries e.g multiple destinations are represented as MULTI. Some fields may also be blank if the SamurAI platform does not have the underlying data.
6 - Reports
Reporting provides you valuable insight into your service and includes metrics which help you understand your organizations security posture and the value of SamurAI MDR.
A standard template entitled Executive Overview is currently available which has been designed to address common needs and highlights different facets of the service.
Create a Report
To create a PDF report from the standard template:
- Login to the SamurAI Portal
- Select Reports from the main menu
- Select Create Report
- Enter a Title for the report (if a title is not provided it will default to the template name)
- Select the Language for the report
- Select a Report start date (this will be from 00:00:00 UTC of start date)
- Select a Report end date (if the current date is selected, the current time will be used. If the current date is not selected the end of day 23:59:59 is used)
- Select Create Report
Report Status
As a report is generated, the status flag can get the following states:
| Status | Description |
|---|
| Queued | Queued and generation of the report will begin |
| Running | Report generation is running |
| Failed | Report generation has failed |
| Completed | Report is complete and available for download |
Should your report fail, click on retry. If it continues to fail check your report start and end date. If all else fails raise a ticket with us!
Viewing a Report
You can view a report once generation has completed by downloading in PDF format, simply click on download ( ).
).
The report will be saved in the following format: ‘Title’_‘start-date’_-_’end-date’.pdf.
Reporting Functionality
Column Filtering ( )
)
- Select Columns to toggle on or off any of the column fields to optimize your view of all report
Filtering ( )
)
- Filter your report list view by any of the fields
Export Report List ( )
)
- You can export your report list to a CSV file
Refresh ( )
)
The Executive Overview Template
The executive overview template was designed to provide insight into the MDR service over a reporting time period you can specify. The report itself is intuitive and self explanatory however below is an outline and description of each report section:
Service Activity
This section of the report focuses on activity related to security incidents, general tickets submitted by your organization via the SamurAI Portal and integration data within the specified reporting period of the report. This includes:
The number of new and closed Security incidents reported to your organization over the reporting period selected.
The number of new and closed General tickets submitted by your organization over the reporting period selected.
New security incidents by severity
- If new security incidents were reported to you within your selected reporting period then a graph will be displayed depicting the number of open security incidents by severity.
- Review Security Incidents for additional information on security incident reporting and severities and MDR Incident Management for our incident management process.
Closed security incidents by severity
- If security incidents were closed during your selected reporting period then a graph will be displayed depicting the number of closed security incidents by severity.
New security incidents by MITRE ATT&CK category
- If new security incidents were reported to you within your selected reporting period then a table will be displayed outlining the number of security incidents reported ranked by MITRE ATT&CK category.
Security incidents
- A table providing additional information of each security incident within the reporting period ranked by creation date.
Security Monitoring Funnel
- The funnel graphic depicts the total number of events from your telemetry sources ingested into SamurAI, the alerts that were analyzed and validated security incidents reported to your organization. This funnel infers the value of the service based on the data analyzed focusing on detecting and reporting threats to your organization.
Data Usage
- This graphic is helpful for you to understand your subscription quota against actual usage.
Data ingested per product
- Graph depiction of data usage per integrated telemetry data source within the reporting period.
Data Ingested
- Further detail on data ingested per integrated telemetry data source within the reporting period.
Alerts Analyzed per vendor
- Graph depiction of alerts analyzed per vendor within the reporting period. The graph shows both vendor alerts and detection made by the SamurAI platform (shown as NTT).
Alerts Analyzed
- A table providing alert counts per vendor within the reporting period. The table shows both vendor alerts and detections made by the SamurAI platform based on the ingested data.
New general tickets by priority
- If your organization submitted any general tickets during your selected reporting period then a graph will be displayed depicting the number of general tickets by priority.
Closed general tickets by priority
- If your organization’s general tickets were closed during your selected reporting period then a graph will be displayed depicting the number of general tickets by priority
New general tickets by category
- If new general tickets were submitted by your organization within your selected reporting period then a table will be displayed outlining the number of general tickets ranked by category.
General Tickets
- A table providing additional information of each general ticket submitted by your organization within the reporting period ranked by creation date.
Current Status
This section of the report focuses on all reported security incidents and also general tickets submitted by your organization as of your reporting end date. This includes:
All open Security Incidents as of reporting end date
All open general tickets submitted by your organization as of the reporting end date
Open security incidents severity
- A graph depicting all open security incidents reported to you by severity as of the reporting end date.
Open security incidents by status
- A graph depicting all open security incidents reported to you by status as of the reporting end date.
Open security incidents by age
- A graph depicting all open security incidents reported to you by ages in days as of the reporting end date.
Open security incidents
- A table providing additional information of all security incidents reported to you as of the reporting end date ranked by age in days.
Open general tickets by priority
- A graph depicting all open general tickets submitted by your organization ranked by priority as of the reporting end date.
Open general tickets by status
- A graph depicting all open general tickets submitted by your organization ranked by status as of the reporting end date.
Open general tickets by age
- A graph depicting all open general tickets submitted by your organization ranked by age days as of the reporting end date.
Open general tickets
- A table providing additional information of all general tickets submitted by your organization as of the reporting end date ranked by age in days.
Trending
This section of the report focuses on historical trends related to open and closed security incidents and general tickets submitted by your organization over the last 13 months from the end date of the reporting period. The start date is when data became available over the 13 month period.
Opened and closed security incidents
- A graph highlighting opened and closed security incidents by month illustrating historical trends over the last 13 months from the reporting end date.
Opened and closed security incidents cumulative
- A cumulative graph highlighting opened and closed security incidents by month illustrating historical trends over the last 13 months from the reporting end date.
Average time to close security incidents
- A graph highlighting the average number of days to close a security incident over the last 13 months from the reporting end date.
Opened and closed general tickets
- A graph highlighting opened and closed general tickets submitted by your organization by month illustrating historical trends over the last 13 months from the reporting end date.
Opened and closed general tickets cumulative
- A cumulative graph highlighting opened and closed general tickets submitted by your organization by month illustrating historical trends over the last 13 months from the reporting end date.
Average time to close general tickets
- A graph highlighting the average number of days to close a ticket submitted by your organization over the last 13 months from the reporting end date.
Data usage
- A graph highlighting data usage over the last 13 months from the reporting end date.
7 - Admin
7.1 - User Management
To view all users of your SamurAI tenant select Admin > User Management from the main menu.
User Management displays information for each user including when they were created, account status and last login.
You also have the ability to export you user list to a CSV file by selecting Export.
Invite Users
To add new users you can send an invite from the SamurAI Portal, this will send an email allowing the user to register their account.
- Login to the SamurAI Portal and select Admin - User Management
- Select Invite Users and add the email address of the user. You can add multiple email addresses as needed.
- An email will be sent from no-reply@security.ntt to each user requesting them to Register Account and complete Account Details.
- Further registration information can be found in Getting Started with SamurAI MDR
User Status
The table below outlines the potential user status:
| User Status | Description |
|---|
| Invited | user has been invited to register account |
| Active | user has registered and is active |
7.2 - User Settings
Select your user account at the top right of the SamurAI Portal to access your settings.
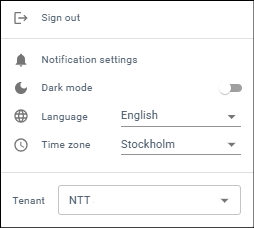
Figure 1: User Settings
Notification Settings
You can manage which email notifications you receive from the SamurAI Platform by adjusting your personal notification settings. These settings apply only to your account and do not affect other users.
To ensure your notification preferences work correctly, notifications must remain enabled for each individual Collector, Integration, and Network Traffic Analyzer.
For details, see the relevant sections:
Notification Behavior by Catgeory
- Collectors, Integrations and Network Traffic Analyzers: Notifications are triggered by status changes (e.g OK, Warning, Critical, Pending, Unknown)
- Security Incidents and General Tickets: Notifications are triggered by actions (e.g created, updated, closed, comment added)
Default Notification Settings
| Notification Category | Default Setting |
|---|
| Collector | Critical Status |
| Integration | Critical Status |
| Network Traffic Analyzer | Critical Status |
| Security Incidents | Created, updated, closed, comment added |
| General Tickets | Created, updated, closed, comment added |
How to Update Your Email Notification Settings
- Open the SamurAI Portal and select your user profile in the top right corner
- Click Notification Settings
- Choose a notification category and use the dropdown menu to select the state or action for which you want to receive email notifications.
Appearance
Choose between a light or dark appearance for the application by toggling between the two modes.
Language
Toggle between the supported languages - English, Swedish or Japanese.
Time Zone
By default, the portal uses your browser’s time zone (detected from your device’s operating system) for timestamps displayed. You can override this by selecting a different time zone in your profile settings.
If you log in from another browser or device, the time zone will reset to that device’s default unless you update your profile once again.
Tenant
Tenants that you belong to are listed. If you have multiple tenants simply select the tenant you wish to view.
News Feed
The news feed is populated by the SamurAI Security Operation Center (SOC) analysts and may include:
- any issues or maintenance affecting service
- news such as how we are handling new and emerging threats
- links to blog posts on interesting security research
- updates on new releases
The news feed is viewed by clicking on the news icon ( ), with the latest title and an indication of any unread news displayed. The latest 15 news items are displayed and more can be fetched by clicking on more at the bottom of the list.
Important news items will be highlighted and include a warning icon beside the title in the feed.
8 - Product Integration Guides
8.1 - Amazon CloudTrail
| SamurAI [Local] Collector | SamurAI [Cloud] Collector |
|---|
|  |
This guide describes the steps required to configure Amazon Web Services (AWS) to send CloudTrail logs to S3 storage for ingestion to Samurai via a cloud collector.
Prerequisites
Ensure that an AWS cloud collector has been deployed via the SamurAI Portal.
If you are planning to reuse an already deployed cloud collector, the information can be found via:
- Navigate to the SamurAI Portal.
- Click Telemetry and select Collectors from the main menu
- Click on the name of the desired collector.
- Note down information:
- Account number
- Bucket name
- Region
Alternatively, you can utilize the integration setup wizard via the SamurAI Portal for the desired telemetry source listed on Product Integration Guide page which shall provide you the same information required to setup your telemetry source.
Enabling CloudTrail Logs
Follow the AWS documentation guide:
When following the vendor documentation, please perform the following adjustments:
- Enable for all accounts in my organization: Recommended to enable.
- Storage Location: Use existing S3 Bucket.
- Trail log bucket name: Select the S3 bucket which you setup during creation of the cloud collector.
- Prefix: Leave empty
- Log file SSE-KMS encryption: If enabled, extend the KMS Policy with:
{
    "Sid": "Allow NTTHS Samurai account to use this KMS key",
    "Effect": "Allow",
    "Principal": {
        "AWS": "arn:aws:iam::600502389717:root"
    },
    "Action": [
        "kms:Decrypt",
        "kms:ReEncrypt*",
        "kms:GenerateDataKey*",
        "kms:DescribeKey"
    ],
    "Resource": "*"
}
- Event Type: At minimum Management events
Our Integration guide was accurate at the time of writing but vendors change things frequently! If you find errors or anything is outdated, let us know by raising a request in the SamurAI MDR Portal and we shall get it updated.
8.2 - Amazon Elastic Load Balancer
| SamurAI [Local] Collector | SamurAI [Cloud] Collector |
|---|
| |
This guide describes the steps required to configure Amazon Web Services (AWS) to send Elastic Load Balancer (ELB) logs to S3 storage for ingestion to Samurai via a cloud collector.
Prerequisites
Ensure that an AWS cloud collector has been deployed via the SamurAI Portal.
If you are planning to reuse an already deployed cloud collector, the information can be found via:
- Navigate to the SamurAI Portal.
- Click Telemetry and select Collectors from the main menu
- Click on the name of the desired collector.
- Note down information:
- Account number
- Bucket name
- Region
Alternatively, you can utilize the integration setup wizard via the SamurAI Portal for the desired telemetry source listed on Product Integration Guide page which shall provide you the same information required to setup your telemetry source.
Enabling Elastic Load Balancer Logging
Follow the official AWS documentation guide:
Attach a policy to your S3 bucket:
- Navigate to Step 2: Attach a policy to your S3 bucket.
- At this stage, you should have already created an S3 bucket or selected an existing one.
- Ensure that the policy you attach grants the necessary permissions for ELB to write logs to the bucket.
Configure access logs:
- Proceed to Step 3: Configure access logs.
- Specify the correct S3 bucket name and prefix.
- Make sure to use the appropriate S3 URI corresponding to the bucket created or selected previously.
Our Integration guide was accurate at the time of writing but vendors change things frequently! If you find errors or anything is outdated, let us know by raising a request in the SamurAI MDR Portal and we shall get it updated.
8.3 - Amazon VPC Flow Logs
| SamurAI [Local] Collector | SamurAI [Cloud] Collector |
|---|
| |
This guide describes the steps required to configure Amazon Web Services (AWS) to send Virtual Private Cloud (VPC) flow logs to S3 storage for ingestion to Samurai via a cloud collector
Prerequisites
Ensure that an AWS cloud collector has been deployed via the SamurAI Portal.
If you are planning to reuse an already deployed cloud collector, the information can be found via:
- Navigate to the SamurAI Portal.
- Click Telemetry and select Collectors from the main menu
- Click on the name of the desired collector.
- Note down information about the:
- Account number
- Bucket name
- Region
Alternatively, you can utilize the integration setup wizard via the SamurAI Portal for the desired telemetry source listed on Product Integration Guide page which shall provide you the same information required to setup your telemetry source.
Enabling Amazon Virtual Private Cloud Flow Logs
Follow the AWS documentation guide:
When following the vendor documentation, please perform the following adjustments:
- Filter: All
- Interval: 1 minute
- S3 Bucket ARN: Select the S3 bucket which you setup during creation of the cloud collector
- Log record format: Select AWS default format.
- Hive-compatible S3 prefixes: Unchecked
- Partition logs by time: Recommended to select Every 1 hour (60 mins)
Our Integration guide was accurate at the time of writing but vendors change things frequently! If you find errors or anything is outdated, let us know by raising a request in the SamurAI MDR Portal and we shall get it updated.
8.4 - Amazon WAF
| SamurAI [Local] Collector | SamurAI [Cloud] Collector |
|---|
| |
This guide describes the steps required to configure Amazon Web Services (AWS) to send Web Application Firewall (WAF) logs to S3 storage for ingestion to Samurai via a cloud collector.
Prerequisites
You will need to deploy an AWS cloud collector via the SamurAI Portal. Follow the steps outlined in:
Alternatively, you can utilize the integration setup wizard via the SamurAI Portal for the desired telemetry source listed on Product Integration Guide page which shall provide you the same information required to setup your telemetry source.
Enabling Amazon Web Application Firewall Logging
Follow the official AWS documentation guide:
Our Integration guide was accurate at the time of writing but vendors change things frequently! If you find errors or anything is outdated, let us know by raising a request in the SamurAI MDR Portal and we shall get it updated.
8.5 - Apache HTTP Server
| SamurAI [Local] Collector | SamurAI [Cloud] Collector |
|---|
| |
This guide describes the steps required to configure Apache HTTP Server hosted on a Linux host to send access and error logs to a Samurai Local Collector deployed on your network by configuring rsyslog.
Connectivity Requirements
| Source | Destination | Ports | Description |
|---|
| Apache HTTP Server | Samurai Local Collector | TCP/514 (syslog) | For log transmission |
Ensure that Apache HTTP Server is configured to log to syslog
Add or modify the ErrorLog and CustomLog directives in your Apache configuration file, normally located at /etc/apache2/apache2.conf:
ErrorLog "|/usr/bin/logger -p local6.error -t apache_error"CustomLog "|/usr/bin/logger -p local6.info -t apache_access" combined
Restart the Apache service to apply the configuration:
sudo systemctl restart apache2
Follow the below steps to configure rsyslog to forward Error and Access events.
Rsyslog prerequisites
Ensure the following statement is included in the main rsyslog configuration file, normally located at /etc/rsyslog.conf:
$IncludeConfig /etc/rsyslog.d/*.conf
If no IncludeConfig statement exist for the /etc/rsyslog.d/ directory, append it to the end of rsyslog.conf.
Create /etc/rsyslog.d/ntt_apache.conf
Create /etc/rsyslog.d/ntt_apache.conf and insert the below configuration block, enter the Local Collector IP in the Target field.
template(name="apache-log" type="string" string="<%PRI%>1 %TIMESTAMP:::date-rfc3339% %HOSTNAME% %APP-NAME% %PROCID% apache_log %STRUCTURED-DATA% %msg%\n")if $programname == 'apache_error' then { action( queue.type="LinkedList" queue.size="10000" type="omfwd" template="apache-log" Target="<Local Collector IP>" Port="514" Protocol="tcp" )}if $programname == 'apache_access' then {action(queue.type="LinkedList" queue.size="10000" type="omfwd" template="apache-log" Target="<Local Collector IP>" Port="514" Protocol="tcp")}
Validate and restart service
Confirm that rsyslog can parse the configuration without any errors by running:
rsyslogd -N1
Then restart the rsyslog service:
sudo systemctl restart rsyslog
The log messages will now be forwarded to the Samurai Local Collector.
For integrations that utilize a Local Collector where we ingest syslog only, you do not need to follow specific steps in the SamurAI MDR portal as we auto detect the vendor and product. The only reason you need to use the SamurAI MDR portal is if you need to determine the Local Collector IP address. Of course you will still need to ensure the integration is functioning! See Integrations for more information on checking status.
Our Integration guide was accurate at the time of writing but vendors change things frequently! If you find errors or anything is outdated, let us know by raising a request in the SamurAI MDR Portal and we shall get it updated.
8.6 - Aruba Networks ClearPass
| SamurAI [Local] Collector | SamurAI [Cloud] Collector |
|---|
| |
This guide describes the steps required to configure Aruba Networks ClearPass to send logs to a Samurai Local Collector deployed in your network.
Connectivity Requirements
You must ensure the following connectivity requirements are available:
| Source | Destination | Ports | Description |
|---|
| Aruba Networks ClearPass | Samurai Local Collector | TCP/514 (syslog) | For log transmission |
Syslog Configuration
Follow the below steps in ClearPass Policy Manager to enable syslog output to the local collector.
Add a Syslog Target using the following parameters:
| Parameter | Value |
|---|
| Host Address | IP of the Samurai Local Collector |
| Protocol | TCP |
| Server Port | 514 |
Create Syslog Export Filters for each event type using the following parameters:
| Parameter | Value |
|---|
| Export Template | Audit Records, Insight Logs and Session Logs |
| Export Event Format Type | CEF |
| Syslog Servers | Syslog target created in the above step |
For integrations that utilize a Local Collector where we ingest syslog only, you do not need to follow specific steps in the SamurAI MDR portal as we auto detect the vendor and product. The only reason you need to use the SamurAI MDR portal is if you need to determine the Local Collector IP address. Of course you will still need to ensure the integration is functioning! See Integrations for more information on checking status.
Our Integration guide was accurate at the time of writing but vendors change things frequently! If you find errors or anything is outdated, let us know by raising a request in the SamurAI MDR Portal and we shall get it updated.
8.7 - Azure Virtual Network
| SamurAI [Local] Collector | SamurAI [Cloud] Collector |
|---|
| |
This guide describes the steps required to configure Virtual Network flow logs to a Storage account for ingestion to Samurai via a cloud collector.
Prerequisites
Ensure that a cloud collector has been deployed via the SamurAI Portal.
The storage account created via the cloud collector needs to reside in the same region as the telemetry sources which will be ingested into the Samurai platform. For ingesting telemetry from multiple regions you need to create additional cloud collector(s) for each region.
Take note of the name of the storage account created and which subscription it resides in. This will be used later when setting up the telemetry sources.
If you are planning to reuse an already deployed cloud collector, the information about the created storage account and subscription can be found via:
- Navigate to the SamurAI Portal.
- On the left navigation pane, click Telemetry and select Collectors.
- Click on the name of the desired collector.
- Note down information about the:
- Subscription
- Storage account name
Alternatively, you can utilize the integration setup wizard via the SamurAI Portal for the desired telemetry source listed on Product Integration Guide page which shall provide you the same information required to setup your telemetry source.
Enabling NSG flow logs
Follow the vendor documentation guide to enable VNet flow logs.
When following the vendor documentation, please perform the following adjustments:
- Ensure when configuring the Storage Account setting that it’s referencing the storage account that was setup during the creation of the cloud collector.
- Ensure the retention period aligns with your storage policies however we recommend at minimum 7 days.
Our Integration guide was accurate at the time of writing but vendors change things frequently! If you find errors or anything is outdated, let us know by raising a request in the SamurAI MDR Portal and we shall get it updated.
8.8 - BeyondTrust Endpoint Privilege Management (EPM)
| SamurAI [Local] Collector | SamurAI [Cloud] Collector |
|---|
| |
This guide describes the steps required to configure BeyondTrust EPM Cloud to send events to a Samurai Cloud Collector.
Prerequisites
Ensure that a Samurai Cloud Collector of type Splunk HTTP Event Collector (HEC) has been deployed via the SamurAI Portal.
If you are planning to reuse an already deployed Samurai HEC Cloud Collector you will need (displayed only upon creation):
From the BeyondTrust Privilege Management Console
Follow the BeyondTrust SIEM settings documentation:
When following the vendor documentation, please use the following:
- Enter the details of your Splunk configuration:
- Hostname: The Samurai Cloud Collector API URL
- Index: (This is ignored by Samurai so enter a dummy value)
- Token: The Samurai Cloud Collector token
- Data format:
- CIM - Common Information Model
Our Integration guide was accurate at the time of writing but vendors change things frequently! If you find errors or anything is outdated, let us know by raising a request in the SamurAI MDR Portal and we shall get it updated.
8.9 - Blackberry CylancePROTECT
| SamurAI [Local] Collector | SamurAI [Cloud] Collector |
|---|
| |
This guide describes the steps required to configure CylancePROTECT to send logs to a Samurai Local Collector deployed on your network. CylancePROTECT requires access to the Local Collector via syslog on port 514/TCP.
To complete this Integration you will need to:
1) From the Cylance Console
Cylance syslog configuration
Samurai Local Collector only supports on-premise deployments of CylancePROTECT
Only CylancePROTECT events are supported
Follow the steps outlined within the Blackberry documentation:
Use the following parameters when completing the steps:
Default settings should be used unless otherwise specified in the listed parameters
| Blackberry Documentation Step | Field Name | Parameter |
|---|
| 3 | Event Types | All types related to CylancePROTECT |
| 5 | SIEM | Other |
| 6 | Protocol | TCP (TLS/SSL unchecked) |
| 8 | IP/Domain | Samurai Local Collector IP address |
| 9 | Port | 514 |
For integrations that utilize a Local Collector where we ingest syslog only, you do not need to follow specific steps in the SamurAI MDR portal as we auto detect the vendor and product. The only reason you need to use the SamurAI MDR portal is if you need to determine the Local Collector IP address. Of course you will still need to ensure the integration is functioning! See Integrations for more information on checking status.
Our Integration guide was accurate at the time of writing but vendors change things frequently! If you find errors or anything is outdated, let us know by raising a request in the SamurAI MDR Portal and we shall get it updated.
8.10 - Check Point Harmony SASE
| SamurAI [Local] Collector | SamurAI [Cloud] Collector |
|---|
| |
This guide describes the steps required to configure Check Point Harmony SASE to send events to a Samurai Cloud Collector.
Prerequisites
Ensure that a Samurai Cloud Collector of type Splunk HTTP Event Collector (HEC) has been deployed via the SamurAI Portal.
If you are planning to reuse an already deployed Samurai HEC Cloud Collector you will need (displayed only upon creation):
From the Check Point Harmony SASE Management Console
Follow the Check Point documentation:
When following the documentation, please use the following:
- Enter these:
- Splunk HEC Host: The Samurai Cloud Collector API URL
- HEC Port: 443
- Protocol: HTTPS
- Verify SSL Certificate: Enabled
- HEC URI: (value is automatically populated)
- Authentication Token: The SamurAI Cloud Collector token
Our Integration guide was accurate at the time of writing but vendors change things frequently! If you find errors or anything is outdated, let us know by raising a request in the SamurAI MDR Portal and we shall get it updated.
8.11 - Check Point Next-Generation Firewall
| SamurAI [Local] Collector | SamurAI [Cloud] Collector |
|---|
| |
To complete this Integration you will need to:
1) Ensure Connectivity Requirements are in place
2) From Check Point Management Console:
3) From the SamurAI Portal:
Connectivity Requirements
| Source | Destination | Ports | Description |
|---|
| Check Point Management Center | Samurai Local Collector | TCP/514 (syslog) | For log transmission |
| Samurai Local Collector | Check Point Management Center | TCP/443 (https) | Application Programming Interface (API) access |
Check point logs will be sent from the management server to the Samurai Local Collector via syslog.
The syslog exporter package must be installed. Dependent on your Check Point version you may need to update. To validate requirements review the Check Point documentation found at:*
Once you have validated or updated your Check Point version follow the steps outlined in the Check Point documentation section Advanced Deployment:
Use the following parameters when completing the Advanced Deployment :
| Field Name | Parameter |
|---|
| Name | Whatever you want, however we suggest: NTT-LOGEXPORT |
| target-server | IP address of your Samurai Local Collector |
| target-port | 514 |
| protocol | tcp |
| format | default |
| read-mode | semi-unified |
| export-attachment-ids | true |
An example of the command to run based on the table above is found below.
cp_log_export add name NTT-LOGEXPORT target-server <SAMURAI Local Collector IP> target-port 514 protocol tcp format default read-mode semi-unified export-attachment-ids true
Create an NTT Account
When you Complete the Check Point Next-Generation Firewall Integration in the SamurAI Portal you can choose to use a username/password or API key for authentication. Note the authentication method when following the steps below.
Follow the Check Point documentation to create an NTT Account with password authentication:
Follow the Check Point documentation to create an NTT Account with API key authentication:
The URL provided directs you to R81 Check Point administrators guide, be sure to follow the steps for your specific version.
Use the following parameters when completing the steps:
| Field Name | Parameter |
|---|
| Name | Whatever you want, however we suggest: NTTUser |
| Authentication method | Select either Check Point Password OR API Key |
| Password | If Authentication method is Password - Set the password in accordance with your policy, you will need this to complete the integration in the SamurAI Portal. |
| Permission Profile | Read Only All (Check Point Documentation) |
Defining Trusted Clients
In order to allow the NTT Account to access the Security Management Server via either username/password or API key it may be needed to configure Trusted Clients in the Check Point Management Console.
Follow the Check Point documentation when defining trusted clients:
General recommendation is to limit access to IPv4 Address and specifying the IP address of the Samurai Local Collector.
IPv4 Address filtering do not always work on all Check Point Management Console versions and one therefore needs to resort to utilize Any instead.
Enable Packet Capture for IPS Protections
Follow the Check Point documentation to enable packet capture for specific profiles:
The URL provided directs you to R81 Check Point Threat Prevention guide, be sure to follow the steps for your specific version.
It is recommended to enable packet capture for all signatures that are active within the used profile.
Use the following parameters when completing the steps:
| Field Name | Parameter |
|---|
| Logging / Track | Log |
| Capture Packets | Enabled (check box) |
Enable Packet Capture for IPS Core Protections
Follow the Check Point documentation to enable packet packet for IPS Core Protections:
The URL provided directs you to R81 Check Point Threat Prevention guide, be sure to follow the steps for your specific version.
It is recommended to enable packet capture for all signatures that are active within the used profile.
Use the following parameters when completing the steps:
| Field Name | Parameter |
|---|
| Logging / Track | Log |
| Capture Packets | Enabled (check box) |
| Protection Scope | Apply to all HTTP traffic |
Complete the Check Point Next-Generation Firewall Integration
Login to the SamurAI Portal
Click Telemetry and select Integrations from the main menu
Click Create
Find and select Check Point Next-Generation Firewall
You will be presented with the Local Collector IP Address on the left of the screen
To configure Extended Telemetry Collection ensure it is enabled via the toggle
Enter the following information:
- Name for the Integration - the name will appear in the SamurAI Portal for you to easily reference
- Description - optional but if completed will appear in the SamurAI Portal for you to easily reference)
- Devicename - an arbitrary name to identify the Check Point device
- IP - IP address of host - this can include multiple separated by a comma (,)
- API-key (optional) - if this is not specified will default to Username/Password
- Domain (optional) - if the user is created in a specific domain, specify the domain
- Username (optional) - enter a username if not using an API-Key
- Password - specify password to use
- Port - if you have changed the default port enter the port number, if not, we default to 443
Click on Finish
Our Integration guide was accurate at the time of writing but vendors change things frequently! If you find errors or anything is outdated, let us know by raising a request in the SamurAI MDR Portal and we shall get it updated.
8.12 - Cisco Identity Services Engine (ISE)
| SamurAI [Local] Collector | SamurAI [Cloud] Collector |
|---|
| |
This guide describes the steps required to configure Cisco Identity Services Engine (ISE) to send logs to a Samurai Local Collector deployed in your network.
Connectivity Requirements
You must ensure the following connectivity requirements are available:
| Source | Destination | Ports | Description |
|---|
| Cisco ISE | Samurai Local Collector | TCP/514 (syslog) | For log transmission |
Table 1: Connectivity requirements
Follow the steps outlined in Remote Logging Target Settings using the following parameters:
| Field Name | Parameter |
|---|
| Target Type | TCP Syslog |
| IP Address | IP address of your Samurai Local Collector |
| Port | 514 |
| Maximum Length | 8192 |
| Comply to RFC 3164 | Enabled |
With the following logging categories enabled:
| Logging Category |
|---|
| AAA Audit |
| Failed attempts |
| Passed Authentications |
| Administrative and Operational Audit |
| Posture and Client Provisioning Audit |
| MDM |
For integrations that utilize a Local Collector where we ingest syslog only, you do not need to follow specific steps in the SamurAI MDR portal as we auto detect the vendor and product. The only reason you need to use the SamurAI MDR portal is if you need to determine the Local Collector IP address. Of course you will still need to ensure the integration is functioning! See Integrations for more information on checking status.
Our Integration guide was accurate at the time of writing but vendors change things frequently! If you find errors or anything is outdated, let us know by raising a request in the SamurAI MDR Portal and we shall get it updated.
8.13 - Cisco IOS
| SamurAI [Local] Collector | SamurAI [Cloud] Collector |
|---|
| |
This guide describes the steps required to configure Cisco Internetwork Operating System (IOS) to send logs to a Samurai Local Collector deployed on your network. Your Cisco IOS device(s) require access to the Local Collector via syslog on port 514/UDP.
To complete this Integration you will need to:
1) From your Cisco IOS device
Use these instructions to configure Cisco IOS.
- Log into the Cisco IOS device and specify the following commands:
1. en
2. conf t
3. no logging on
4. archive
5. log config
6. logging enable
7. logging size 1000
8. notify syslog contenttype plaintext
9. hidekeys
10. exit
11. exit
The preceding exit commands will take you from the config-archive-log-cfg command mode to the config command mode.
12. logging host [Local Collector IP Address] where [Local Collector IP Address] is the IP address of the Samurai Local Collector deployed on your network.
13. logging trap 6
14. login on-failure log every 1
15. login on-success log every 1
16. logging origin-id hostname
17. logging source-interface [Interface Name] where [Interface Name] is the name of the interface that has access to the Samurai Local Collector.
18. no service sequence-numbers
19. no service timestamps
20. service timestamps log datetime localtime show-timezone
21. no logging message-counter syslog
22. no logging console
23. no logging monitor
24. logging buffered 16384 informational
25. logging on
26. end
27. wr mem
Test the logging configuration
- Execute the following commands to generate a %SYS-5-CONFIG_I log.
conf t
end
This will test the configuration and connectivity to the Samurai Local Collector.
To configure logging of specific ACLs, add the option log to the end of the ACL to be monitored. For example:
access-list 101 deny tcp any host 192.168.35.0/24 25 log
For integrations that utilize a Local Collector where we ingest syslog only, you do not need to follow specific steps in the SamurAI MDR portal as we auto detect the vendor and product. The only reason you need to use the SamurAI MDR portal is if you need to determine the Local Collector IP address. Of course you will still need to ensure the integration is functioning! See Integrations for more information on checking status.
Our Integration guide was accurate at the time of writing but vendors change things frequently! If you find errors or anything is outdated, let us know by raising a request in the SamurAI MDR Portal and we shall get it updated.
8.14 - Cisco Meraki
| SamurAI [Local] Collector | SamurAI [Cloud] Collector |
|---|
| |
This guide describes the steps required to configure Cisco Meraki Security Appliances to send logs to a Samurai Local Collector deployed on your network. Cisco appliances require access to the Local Collector via syslog on port 514/UDP.
To complete this Integration you will need to:
1) From the Meraki Dashboard:
Meraki syslog configuration
Log in to the Meraki Dashboard and complete the following steps:
- Click Network-wide.
- Click General.
- Click Add a syslog server.
- In the Server IP field, enter the IP address of the Collector appliance deployed on your network.
- Specify the Port as 514.
- Select all the available Roles.
- Click Save.
For integrations that utilize a Local Collector where we ingest syslog only, you do not need to follow specific steps in the SamurAI MDR portal as we auto detect the vendor and product. The only reason you need to use the SamurAI MDR portal is if you need to determine the Local Collector IP address. Of course you will still need to ensure the integration is functioning! See Integrations for more information on checking status.
Our Integration guide was accurate at the time of writing but vendors change things frequently! If you find errors or anything is outdated, let us know by raising a request in the SamurAI MDR Portal and we shall get it updated.
8.15 - Cisco Secure Endpoint
| SamurAI [Local] Collector | SamurAI [Cloud] Collector |
|---|
| |
Cisco Secure Endpoint logs and data are collected via REST API.
To complete this Integration you will need to:
1) Within the Cisco Secure Endpoint web interface
2) From Cisco Secure Malware Analytics
3) From the SamurAI Portal:
Determine API Endpoint
The URL for API access Secure Endpoint depends on the region the instance is located, at the time of writing the following are available:
- api.amp.cisco.com
- api.apjc.amp.cisco.com
- api.consumer.amp.cisco.com
- api.eu.amp.cisco.com
The URL for API access to Secure Malware Analytics depends on the region the instance is located, at the time of writing the following are available:
Take note of the appropriate URLs as it will be required when completing the Integration within the SamurAI Portal.*
Generate API Credentials
Use the steps below to generate API credentials to allow a Samurai cloud collector to gather telemetry from Secure Endpoint:
Log in to your Cisco Secure Endpoint Instance.
Click Accounts > API Credentials
Click + New API Credential
Add a new API key with the following information:
In the Application name field, enter an appropriate name
From the Scope list, ensure Read & Write is selected
Click Create
The API credentials are displayed
Make a note of the 3rd Party API Client ID and API Key values
The Read & Write scope is required to create the stream for collecting events.
You will need the API Client ID and API Key when completing the integration within the SamurAI Portal.
Generate Secure Malware Analytics API Credentials
Use these steps to generate API credentials to allow Samurai to gather telemetry from Secure Malware Analytics:
Log in to your Cisco Secure Malware Analytics Instance.
In the top-right click on your account name,then My Account
If no API key has been generated previously, click Generate API Key
Make a note of the API Key
You will need the API Key when completing the integration within the SamurAI Portal.
Complete the Cisco Secure Endpoint Integration
You will need:
Login to the SamurAI Portal
Click Telemetry and select Integrations
Select Create
Locate and click Cisco Secure Endpoint
Click Next (we leverage a Samurai Cloud Collector)
Enter a Name of Integration
Enter a Description (Optional)
Enter your Devicename
Enter your API Endpoint
Enter your API Client ID
Enter your API Key
Enter your Secure Malware Analytics Endpoint
Enter your Secure Malware Analytics API Key
Click Finish
Our Integration guide was accurate at the time of writing but vendors change things frequently! If you find errors or anything is outdated, let us know by raising a request in the SamurAI MDR Portal and we shall get it updated.
8.16 - Cisco Secure Firewall (ASA)
| SamurAI [Local] Collector | SamurAI [Cloud] Collector |
|---|
| |
This guide describes the steps required to configure Cisco Secure Firewall (ASA Appliances) to send logs to a Samurai Local Collector deployed on your network. Your Cisco appliances require access to the Local Collector via syslog on port 514/UDP.
To complete this Integration you will need to:
1) From your Cisco Firewall:
Perform the following steps to configure syslog:
Log in to the Cisco ASA
From the command line specify the following commands to setup logging:
en
conf t
logging enable
logging timestamp
logging device-id
logging standby
logging trap debugging
logging queue 1024
logging host [interface name] [Local Collector IP Address]
where:
[interface name] is the name of the interface closest/routable to the Local Collector, and
[Local Collector IP Address ] is the IP address of the Samurai Local Collector deployed on your
network .
For integrations that utilize a Local Collector where we ingest syslog only, you do not need to follow specific steps in the SamurAI MDR portal as we auto detect the vendor and product. The only reason you need to use the SamurAI MDR portal is if you need to determine the Local Collector IP address. Of course you will still need to ensure the integration is functioning! See Integrations for more information on checking status.
Our Integration guide was accurate at the time of writing but vendors change things frequently! If you find errors or anything is outdated, let us know by raising a request in the SamurAI MDR Portal and we shall get it updated.
8.17 - Cisco Secure Firewall (FTD)
| SamurAI [Local] Collector | SamurAI [Cloud] Collector |
|---|
| |
This guide describes the steps required to configure Cisco Secure Firewall Threat Defense (FTD) (previously entitled Firepower Threat Defense) to send syslog to a Samurai Local Collector.
Cisco Secure Firewall Management Center (FMC) is required.
1) Ensure Connectivity Requirements are in place
2) From Cisco Secure Firewall Management Center console:
3) From the SamurAI Portal
Connectivity Requirements
You must ensure the following connectivity requirements are available:
| Source | Destination | Ports | Description |
|---|
| FTD | Samurai Local Collector | UCP/514 (syslog) | For log transmission |
| Samurai Local Collector | FMC | TCP/1500 & TCP/2000 | Database access |
Send Security Event Syslog Messages from FTD Devices
Follow the steps outlined within the Cisco documentation:
Default settings should be used unless otherwise specified in the listed parameters.
Cisco Documentation Step 1:
Use the following parameters:
| Cisco Documentation Step | Field Name | Parameter |
|---|
| 1d | IP Address | Samurai Local Collector IP address (verify or add the address) |
| 1d | Protocol | UDP |
| 1d | Port | 514 |
| 1d | Security Zones or Named Interface | Select the interface/zone on which the Samurai Local Collector is reachable |
| 1e | Time Stamp Format | RFC 5424 (yy-MM-ddTHH:mm:ssZ) |
| 1e | Enable Syslog Device ID | Enabled (Host Name) |
| 1f | Send syslogs in EMBLEM format | Unchecked |
Cisco Documentation Step 2:
Use the following parameters:
| Field Name | Field Name | Parameter |
|---|
| 2f | IPS Settings | Send Syslog Messages for IPS Events (Selected) |
| 2f | File and Malware Settings | Send Syslog messages for File and Malware events (Selected) |
Cisco Documentation Step 3:
Complete the steps outlined.
Cisco Documentation Step 4:
Use the following parameters:
| Field Name | Field Name | Parameter |
|---|
| 4d | Logging | Log at End of Connection (Selected) |
Cisco Documentation Step 5:
Complete the steps outlined.
This step if only applicable if using Snort 2
Enabling External Access to the Database
Follow the steps outlined within the Cisco documentation:
Use the following parameters when completing the steps:
| Field Name | Parameter |
|---|
| Allow External Database Access | Enabled |
| Server Hostname | If this is blank, enter the IP address of the Cisco Firepower Management Center that is being configured. |
| Add Hosts > IP Address | IP address of your Samurai Local Collector |
Database User Creation
Follow the steps outlined within the Cisco documentation:
Use the following parameters when completing the steps:
| Field Name | Parameter |
|---|
| User Name | Whatever you want |
| Authentication > Use External Authentication Method | Unchecked |
| Password | Whatever you want, but need to comply with Password Policy |
| Options | Only check Check Password Strength. Other than that, unchecked. |
| Default User Roles | Only check External Database User. Other than that, unchecked. |
Complete the Cisco Secure Firewall (Firepower Threat Defense) Integration
- Login to the SamurAI Portal
- Click Telemetry and select Integrations from the main menu
- Click Create
- Find and select Cisco Secure Firewall (Firepower Threat Defense)
- Select the relevant Local Collector and click Next
- You will be presented with the Local Collector IP Address
- Click Next
- Complete the fields required including the Database Username and Password you created in Database user creation
- Click on Finish
Our Integration guide was accurate at the time of writing but vendors change things frequently! If you find errors or anything is outdated, let us know by raising a request in the SamurAI MDR Portal and we shall get it updated.
8.18 - Cisco Umbrella
| SamurAI [Local] Collector | SamurAI [Cloud] Collector |
|---|
| |
This guide describes the steps required to configure Cisco Umbrella to send logs to S3 storage for ingestion to Samurai via a cloud collector.
Prerequisites
Cisco Umbrella integration requires a self managed AWS S3 bucket. For more information on Cisco Umbrella logging refer to the Cisco documentation
Manage Your Logs.Ensure that an AWS cloud collector has been deployed via the SamurAI Portal.
Upon creation of the cloud collector you must have selected Yes under AWS Configuration - Enable Cisco Umbrella access to S3 Bucket via Bucket Policy
If you are planning to reuse an already deployed AWS cloud collector, the information can be found via:
- Navigate to the SamurAI Portal.
- Click Telemetry and select Collectors from the main menu
- Click on the name of the desired collector.
- Note down information:
- Account number
- Bucket name
- Region
Alternatively, you can utilize the integration setup wizard via the SamurAI Portal for the desired telemetry source listed on Product Integration Guide page which shall provide you the same information required to setup your telemetry source.
Enable Logging in the Cisco Umbrella Console
Ensure you have the exact name of the AWS S3 bucket
Follow the Enable Logging section (Steps 1-3) in the Cisco Umbrella documentation:
Our Integration guide was accurate at the time of writing but vendors change things frequently! If you find errors or anything is outdated, let us know by raising a request in the SamurAI MDR Portal and we shall get it updated.
8.19 - Citrix Netscaler (Formely Netscaler ADC)
| SamurAI [Local] Collector | SamurAI [Cloud] Collector |
|---|
| |
This guide describes the steps required to configure Citrix Netscaler to send logs to a Samurai Local Collector deployed on your network. Citrix Netscaler requires access to the Local Collector via syslog on port 514/UDP.
To complete this Integration you will need to:
1) From your Citrix Netscaler Appliance :
Follow the steps outlined within the Citrix documentation:
Use the following parameters when completing the steps:
| Field Name | Parameter |
|---|
| Auditing Type | SYSLOG |
| Name | Whatever you want, however we suggest NTT_syslog_action |
| ServerIP | IP address of your Samurai Collector |
| serverPort | 514 |
| logLevel | EMERGENCY,ALERT,CRITICAL,ERROR,WARNING,NOTICE,INFORMATIONAL |
| dateFormat | MMDDYYYY |
| transport | UDP |
Table 1: Audit-log Action
| Field Name | Parameter |
|---|
| Name | Whatever you want, however we suggest NTT_syslog_policy |
| rule | Use the Audit-log action you created above. |
Table 2: Audit-log Policy
For integrations that utilize a Local Collector where we ingest syslog only, you do not need to follow specific steps in the SamurAI MDR portal as we auto detect the vendor and product. The only reason you need to use the SamurAI MDR portal is if you need to determine the Local Collector IP address. Of course you will still need to ensure the integration is functioning! See Integrations for more information on checking status.
Our Integration guide was accurate at the time of writing but vendors change things frequently! If you find errors or anything is outdated, let us know by raising a request in the SamurAI MDR Portal and we shall get it updated.
8.20 - Claroty Continuous Threat Detection (CTD)
| SamurAI [Local] Collector | SamurAI [Cloud] Collector |
|---|
| |
This guide describes the steps required to configure Claroty CTD to send logs to a Samurai Local Collector deployed on your network. Claroty CTD requires access to the Local Collector via syslog on port 514/TCP.
Prerequisites
This document supports Claroty CTD versions 3.x, and 4.x.
The following integration will configure Rules for Baseline, Event and Alert Logs. A user account is also created for read-only API access to gather additional telemetry.
To complete this Integration you will need to:
1) From the Claroty Web management user interface
2) From the SamurAI Portal
- Log in to Claroty’s web configuration dashboard.
- Click the Configuration tab.
- In the Networks area:
- Select the checkbox to enable Save Caps
- Select the checkbox to enable Detect Known Threats
Configuration of Rules
If a field is not mentioned, please leave it unchanged.
Baseline Rule
Log in to Claroty’s web configuration dashboard.
On the main menu on the left, click Configuration
Select Integrations > SIEM Syslog
Complete the following steps to add a rule to send baseline logs:
In the SIEM Syslog screen click on the “+” button
In the From list, click the relevant site(s)
The Add new Syslog screen will appear
Update the following fields:
- Uncheck the LOCAL checkbox
- From the MESSAGE CONTENTS list, click Baselines
- From the MESSAGE FORMAT list, click CEF
- Protocol - select all from the available list
- Communication Type - select all available options
- Access Type - select all available options
- Server - enter in the IP address of your Samurai Local Collector
- Port - enter 514
- Protocol - TCP
Click Save
Events Rule
Log in to Claroty’s web configuration dashboard.
On the main menu on the left, click Configuration
Select Integrations > SIEM Syslog
Complete the following steps to add a rule to send Events logs:
In the SIEM Syslog screen click on the “+” button
In the From list, click the relevant site(s)
The Add new Syslog screen will appear
Update the following fields:
- Uncheck the LOCAL checkbox
- From the MESSAGE CONTENTS list, click Events
- From the MESSAGE FORMAT list, click CEF
- Below Select Filters for the corresponding alerts configure:
- Category - select all available selections
- Protocol - select all from the available list
- Server - enter in the IP address of your Samurai Local Collector
- Port - enter 514
- Protocol - TCP
Click Save
Alert Rule
Log in to Claroty’s web configuration dashboard.
On the main menu on the left, click Configuration
Select Integrations > SIEM Syslog
Complete the following steps to add a rule to send Alerts logs:
In the SIEM Syslog screen click on the “+” button
In the From list, click the relevant site(s)
The Add new Syslog screen will appear
Update the following fields:
- Uncheck the LOCAL checkbox
- From the MESSAGE CONTENTS list, click Alerts
- From the MESSAGE FORMAT list, click CEF
- Category - select all available selections
- Protocol - select all from the available list
- Server - enter in the IP address of your Samurai Local Collector
- Port - enter 514
- Protocol - TCP
Click Save
Create an account for API access
- Log in to Claroty’s web configuration dashboard.
- On the main menu select Configuration and Users
- In the User Management configuration screen, Click Add new users
- Enter a Username
- Enter a Full Name
- Enter a Password
- Repeat the Password
- Click Add
You will need to provide these credentials to NTT during onboarding.
If your Security and Authentication > Password Expires are not set to 0 (0=unlimited) you will need to ensure you update the password before it expires.
Create a Group with permissions for the API access account
If a field is not mentioned, please leave it unchanged
- Log in to Claroty’s web configuration dashboard.
- On the main menu select Configuration and Groups
- In the Group Management configuration screen, Click Add new groups
- Enter a Group Name
- Select the user created in Create an account for API access from the Add User dropdown list
- In the Systems Permissions area, Click Add permission
- Select specific sites to which the permissions applies, or All Sites
- From the All dropdown list, select relevant option
- Set the appropriate permission level to Read
- Click Save
Complete the Claroty Continuous Threat Detection (CTD) Integration
Login to the SamurAI Portal
Click Telemetry and select Integrations from the main menu
Click Create
Find and select Claroty Continuous Threat Detection (CTD)
Select the relevant Local Collector and click Next
You will be presented with the Local Collector IP Address on the left of the screen
To configure Extended Telemetry Collection ensure it is enabled via the toggle
Enter the following information:
- Name for the Integration - the name will appear in the SamurAI Portal for you to easily reference
- Description - optional but if completed will appear in the SamurAI Portal for you to easily reference)
- Devicename - an arbitrary name to identify the Claroty CTD device
- IP Address - the IP address of Claroty CTD
- Username - enter the username you created in Create an account for API access
- Password - enter the password you created in Create an account for API access
- Port (Optional)- if you have changed the default port enter the port number, if not, we default to 5000
Click on Finish
Our Integration guide was accurate at the time of writing but vendors change things frequently! If you find errors or anything is outdated, let us know by raising a request in the SamurAI MDR Portal and we shall get it updated.
8.21 - Claroty xDome
| SamurAI [Local] Collector | SamurAI [Cloud] Collector |
|---|
| |
This guide describes the steps required to configure Claroty xDome to send logs to a Samurai Local Collector deployed in your network.
Connectivity Requirements
You must ensure the following connectivity requirements are available:
| Source | Destination | Ports | Description |
|---|
| Claroty xDome Collection Server | Samurai Local Collector | TCP/514 (syslog) | For log transmission |
Table 1: Connectivity requirements
Follow the steps outlined in About Claroty Syslog (Claroty login is required) using the following parameters:
| Field Name | Parameter |
|---|
| Destination IP | IP address of your Samurai Local Collector |
| Transport Protocol | TCP |
| Destination Port | 514 |
| Message Format | JSON |
| Syslog Protocol Standard | RFC 5424 |
| Installation Server | Select your xDome collection server |
| Export Comm. Events | ON. Select All Event Types and All Devices |
| Export Alerts | ON. Select All Alert Types |
| Export Vulnerabilities | ON. Select All |
Table 2: Claroty Syslog Configuration
For integrations that utilize a Local Collector where we ingest syslog only, you do not need to follow specific steps in the SamurAI MDR portal as we auto detect the vendor and product. The only reason you need to use the SamurAI MDR portal is if you need to determine the Local Collector IP address. Of course you will still need to ensure the integration is functioning! See Integrations for more information on checking status.
Our Integration guide was accurate at the time of writing but vendors change things frequently! If you find errors or anything is outdated, let us know by raising a request in the SamurAI MDR Portal and we shall get it updated.
8.22 - Clavister NetWall
| SamurAI [Local] Collector | SamurAI [Cloud] Collector |
|---|
| |
This guide describes the steps required to configure a Clavister NetWall firewall to send syslog events to a Samurai Local Collector deployed in your network.
Connectivity Requirements
| Source | Destination | Ports | Description |
|---|
| Clavister NetWall | Samurai Local Collector | TCP/514 or UDP/514 | For log transmission |
Follow the vendor documentation to add a new syslog receiver:
Perform the steps under section Example 2.29. Enabling Syslog RFC-5424 Compliance with Hostname.
Adjust Syslog service to TCP
Optionaly, in the cOS Core web interface:
- Navigate to: Objects -> Serivces
- Click on Syslog
- Modify Type and set the protocol to TCP
For integrations that utilize a Local Collector where we ingest syslog only, you do not need to follow specific steps in the SamurAI MDR portal as we auto detect the vendor and product. The only reason you need to use the SamurAI MDR portal is if you need to determine the Local Collector IP address. Of course you will still need to ensure the integration is functioning! See Integrations for more information on checking status.
Our Integration guide was accurate at the time of writing but vendors change things frequently! If you find errors or anything is outdated, let us know by raising a request in the SamurAI MDR Portal and we shall get it updated.
8.23 - Click Studios Passwordstate
| SamurAI [Local] Collector | SamurAI [Cloud] Collector |
|---|
| |
Ensure correct network connectivity
You must ensure the following connectivity requirements are fulfilled:
| Source | Destination | Ports | Description |
|---|
| Passwordstate | Samurai Local Collector | TCP/514 | For log transmission |
Follow the documentation for syslog server configuration in section 4.9 of the Passwordstate Security Administrators Manual, using the following parameters:
- Syslog Server: IP address of the Samurai Local Collector
- Port Number: 514
- Protocol: TCP
For integrations that utilize a Local Collector where we ingest syslog only, you do not need to follow specific steps in the SamurAI MDR portal as we auto detect the vendor and product. The only reason you need to use the SamurAI MDR portal is if you need to determine the Local Collector IP address. Of course you will still need to ensure the integration is functioning! See Integrations for more information on checking status.
Our Integration guide was accurate at the time of writing but vendors change things frequently! If you find errors or anything is outdated, let us know by raising a request in the SamurAI MDR Portal and we shall get it updated.
8.24 - Crowdstrike Falcon
| SamurAI [Local] Collector | SamurAI [Cloud] Collector |
|---|
| |
To complete this Integration you will need to:
1) From the Crowdstrike Falcon Console:
2) From the SamurAI Portal:
3) Complete and send authorization form
Create a new API client
For additional information you can refer to the Crowdstrike documentation
Crowdstrike credentials with the Falcon Administrator role are required to create API clients.
To create a new API client follow the steps below:
Log in to the Crowdstrike Falcon Console
Click the Support and resources icon in the left menu pane.
Under Resources and tools select API Clients and Keys. The API Clients and Keys page is displayed.
Click Create API client. The Create API client page appears.
Perform the following steps:
5.1 Specify NTT API Client in the CLIENT NAME field.
5.2 Specify API client for NTT in the DESCRIPTION field.
5.3 Under API SCOPES, perform the following steps:
5.4 Select the Read checkbox for:
- Detections
- Event Streams
- Host groups
- Hosts
- Prevention policies
- Threatgraph
- User Management
5.5 Select the Write checkbox for:
Click Create to save the API client and generate the client ID and secret.
Copy and record the values:
- Take note of your Cloud location which is dervived from the Base URL as per the table below, you will need to specify the cloud location under Complete the Crowdstrike Falcon Insight Integration.
The table below outlines the Cloud location and Base URL:
Complete the Crowdstrike Falcon Insight Integration
You will need:
Login to the SamurAI Portal
Click Telemetry and select Integrations from the main menu
Select Create
Locate and click Crowdstrike Falcon Insight
Click Next (we leverage a Samurai Cloud Collector)
Enter a Name of Integration
Enter a Description (Optional)
Enter your OAuth Client ID
Enter your OAuth Secret
Select your Cloud Location (US-1 is default).
Click Finish
The Samurai SOC requires access to your Crowdstrike instance in order to:
- Perform deeper investigations
- Access data not present in the APIs
- Perform remote isolation tasks
To ensure the Samurai SOC has access please complete this form Authorization Form for Access to Crowdstrike Falcon Host by MSP Personnel.
Once you have completed, email the form to mssp@crowdstrike.com.
Our Integration guide was accurate at the time of writing but vendors change things frequently! If you find errors or anything is outdated, let us know by raising a request in the SamurAI MDR Portal and we shall get it updated.
8.25 - Crowdstrike Falcon Data Replicator
| SamurAI [Local] Collector | SamurAI [Cloud] Collector |
|---|
| |
This guide explains how to configure CrowdStrike Falcon Data Replicator (FDR) so that security telemetry is ingested into the SamurAI platform via AWS SQS.
CrowdStrike FDR delivers data by:
- Writing event files to a CrowdStrike managed S3 bucket
- Publishing notifications to a CrowdStrike managed SQS queue
- Allowing authorized consumers (such as SamurAI) to read data using FDR credentials
Prerequisites
1. CrowdStrike Licensing
- Falcon Data Replicator (FDR) must be enabled on the Falcon tenant
- This requires an active FDR subscription
- If FDR is not enabled, CrowdStrike Support must enable it first
2. Permissions
The user performing setup must have access to:
- Support - API Clients and Keys in the Falcon console
- Permission to create API Clients with FDR read access
For additional information refer to the Falcon Data Replicator documentation available from the Crowdstrike Falcon Console.
From the Crowdstrike Falcon Console
Verify FDR is Enabled
- Log in to CrowdStrike Falcon Console
- Navigate to:
- Support - API Clients and Keys
- Confirm that FDR AWS S3 Credentials and SQS Queue is visible.
If not present, open a ticket with CrowdStrike Support to enable FDR.
Create FDR API Credentials
- In Support - API Clients and Keys
- Locate FDR AWS S3 Credentials and SQS Queue
- Click Create new credentials
- CrowdStrike will generate:
- Client ID (also referred to as AWS Access Key)
- Client Secret (also referred to as AWS Secret Key)
Copy and securely store the Secret immediately. The secret is only shown once and cannot be retrieved later.
Collect the SQS Queue URL
- In the same FDR AWS S3 Credentials and SQS Queue section
- Locate the SQS Queue URL
- Copy the full URL (for example:
This URL is the Feed URL required for the SamurAI platform integration.
Identify the Storage Region
This region must be entered exactly as shown.
Complete the Crowdstrike FDR Integration
You will need:
Login to the SamurAI Portal
Click Telemetry and select Integrations from the main menu
Select Create
Locate and click Crowdstrike Falcon Data Replicator
Click Next (we leverage a Samurai Cloud Collector)
Enter a Name of Integration
Enter a Description (Optional)
Enter your Client ID
Enter your Secret
Enter the Storage Region
Enter the Feed URL
Click Finish
Our Integration guide was accurate at the time of writing but vendors change things frequently! If you find errors or anything is outdated, let us know by raising a request in the SamurAI MDR Portal and we shall get it updated.
8.26 - CyberArk Privileged Access Security
| SamurAI [Local] Collector | SamurAI [Cloud] Collector |
|---|
| |
This guide describes the steps required to configure CyberArk Privilegd Access Security (PAS) to send logs to a Samurai Local Collector deployed on your network. Your CyberArk PAS Vault deployment requires access to the Local Collector via syslog on port 514/UDP.
To complete this Integration you will need to:
1) From CyberArk Vault
Follow the steps below, you may also wish to refer to CyberArk documentation.
Download ntt.xsl.
Log in to the (primary) CyberArk PAS Vault server as the administrator user
Navigate to the <CyberArk install folder>\Server\Syslog directory.
- By default, the subdirectory is: C:\Program Files (x86)\PrivateArk\Server\Syslog
Copy the ntt.xsl file into the directory.
Navigate to the <CyberArk install folder>\Server\ directory.
- By default, the subdirector is: C:\Program Files (x86)\PrivateArk\Server\
Copy the existing DBParm.ini file to DBParm.ini.bak file within the same directory (in case you need to rollback)
Edit the DBParm.ini file and make the following configuration changes:
If you are configuring more than one syslog destination, each parameter must match the number of hosts in SyslogServerIP. Each CSV position in SyslogServerIP will correspond with the same CSV position in other fields.
For example:
SyslogServerIP=1.1.1.1,2.2.2.2
SyslogServerPort=514,6514
In the above example, server 1.1.1.1 would match with port 514, while server 2.2.2.2 would match with port 6514.
- For SyslogServerIP, enter the IP address of the Samurai Local Collector deployed on your network.
- For SyslogServerPort, enter 514
- For SyslogServerProtocol, enter TCP
- For SyslogTranslatorFile, enter Syslog\ntt.xsl
This is the file mentioned in step 1 & 4 - For SyslogMessageCodeFilter, enter 0-999.
- For UseLegacySyslogFormat, enter No.
The changes to DBParm.ini should look like the following example:
[SYSLOG]SyslogServerIP=1.1.1.1SyslogServerPort=514SyslogServerProtocol=TCPSyslogTranslatorFile=Syslog\ntt.xslSyslogMessageCodeFilter=0-999UseLegacySyslogFormat=No
Apart from the SyslogServerIP parameter, ensure that the parameter statements match those shown above. If you are copying and pasting from this document, ensure that each parameter statement is on a separate line and that no unwanted spaces are introduced.
Save the file
Restart the Vault server
Ensure that there are no errors in the log file. A list of possible messages that could appear in the log file are included in CyberArk documentation -
Syslog Messages- If applicable. perform the procedure on all Primary and Satellite Vaults.
For integrations that utilize a Local Collector where we ingest syslog only, you do not need to follow specific steps in the SamurAI MDR portal as we auto detect the vendor and product. The only reason you need to use the SamurAI MDR portal is if you need to determine the Local Collector IP address. Of course you will still need to ensure the integration is functioning! See Integrations for more information on checking status.
Our Integration guide was accurate at the time of writing but vendors change things frequently! If you find errors or anything is outdated, let us know by raising a request in the SamurAI MDR Portal and we shall get it updated.
8.27 - Digital Arts i-FILTER
| SamurAI [Local] Collector | SamurAI [Cloud] Collector |
|---|
| |
This guide describes the steps required to configure Digital Arts i-FILTER to send events to a Samurai Local Collector deployed in your environment.
Product Version Requirements
i-Filter must at least the following version:
Samurai MDR leverages the access log transfer function of i-Filter for Linux v.10 which is not supported under i-Filter for Windows.
Connectivity Requirements
| Source | Destination | Ports | Description |
|---|
| i-Filter | Samurai local collector | TCP/514 | For log transmission |
i-Filter Access Log Settings
Follow the steps outlined within each section below:
Access Log Settings
Login to the i-Filter management console
Go to System / Log / Access Log Settings
Configure the parameters below:
- Set Format Setting to Detailed Mode
- Specify Format as indicated in the table below.
| Output Order | Field Name | Field Content |
|---|
| 1 | output_log_date | Access log output date and time |
| 2 | process_id | Process number |
| 3 | product | Product |
| 4 | vendor | Vendor |
| 5 | ifilter_version | i-Filter version |
| 6 | realy_proxyip | Upper proxy server IP address |
| 7 | public_ip Source | IP address |
| 8 | src_ip | Client |
| 9 | hostname | Computer name |
| 10 | access_date | Access start date and time |
| 11 | status | HTTP response code |
| 12 | bytes_in | HTTP response size |
| 13 | bytes_out | HTTP request size |
| 14 | filter_action | Filter action |
| 15 | r_id | Rule object ID |
| 16 | virus_name | Virus name |
| 17 | ssl_parameter | SSL parameter encryption presence |
| 18 | post_info | File information at the time of POST |
| 19 | http_method | HTTP method |
| 20 | http_version | HTTP version |
| 21 | http_referer | HTTP referrer |
| 22 | http_user_agent | HTTP user agent |
| 23 | http_content_type_raw | HTTP content type |
| 24 | dest_ip | Destination IP address |
| 25 | dest_port | Destination port number |
| 26 | src_port | Source port number |
| 27 | client_port | Client port number |
| 28 | dest_host | Destination host name |
| 29 | user | Authentication user name (non-encoded) |
| 30 | group_name | Group name (non-encoded) |
| 31 | url | URL (non-encoded) |
| 32 | ss_time | Session time |
| 33 | au_status | Authentication status |
| 34 | filter_reason | Filter reason (non-encoded) |
| 35 | url_category_list | URL category list name (non-encoded) |
| 36 | web_service_name | Web service name (non-encoded) |
| 37 | http_response | HTTP response code (upper) |
| 38 | checksum | Checksum |
The log format must follow the output order and be specified as indicated in the above table. An example of the log format is displayed in the next section.
Log Output Settings
The log format must be set as follows. In this document it is displayed with line breaks but in reality it is a single line:
output_log_date="%ltl",process_id="%pid",product="ifilter",vendor="DigitalArts",ifilter_version="%vr"
,realy_proxyip="%pp",public_ip="%sip",src_ip="%>a",hostname="%>A",access_date="%tl",status="%hst",
bytes_in="%<st",bytes_out="%>st",filter_action="%bk",r_id="%rid",virus_name="%vi",ssl_parameter="%en"
,post_info="%pl",http_method="%rm",http_version="%rv",http_referer="%hrf",http_user_agent="%hua",
http_content_type_raw="%mt",dest_ip="%dip",dest_port="%dpt",src_port="%spt",client_port="%cpt",
dest_host="%hnm",user="%Dul",group_name="%Dgn",url="%Dru",ss_time="%Tss",au_status="%Aus",
filter_reason="%DFR",url_category_list="%DCT",web_service_name="%DWID",http_response="%hrst",checksum="%ccs"
Access Log Transfer Settings
From the i-Filter management console
Go to System / Log / Access Log Transfer Settings
Configure the parameters below:
- Enable the Access Log Transfer Function
- Set the Maximum Size per Line to 64 KB
Access Log Transfer Server Settings
From the i-Filter management console
Go to System / Log / Access Log Transfer Server Settings
Configure the parameters below:
- Enable the Effective Setting
- Specify the target set in Access Log Tansfer Settings for Access Log Settings
- Set the Address to the IP address of the Samurai Local Collector deployed on your network
- Set the Port Number to 514
- Set the Transfer Protocol to TCP
- Set the Transfer Format to syslog format
For integrations that utilize a Local Collector where we ingest syslog only, you do not need to follow specific steps in the SamurAI MDR portal as we auto detect the vendor and product. The only reason you need to use the SamurAI MDR portal is if you need to determine the Local Collector IP address. Of course you will still need to ensure the integration is functioning! See Integrations for more information on checking status.
Our Integration guide was accurate at the time of writing but vendors change things frequently! If you find errors or anything is outdated, let us know by raising a request in the SamurAI MDR Portal and we shall get it updated.
8.28 - ESET PROTECT
| SamurAI [Local] Collector | SamurAI [Cloud] Collector |
|---|
| |
This guide describes the steps required to configure ESET PROTECT On-Prem to send logs to a Samurai Local Collector deployed in your network.
Connectivity Requirements
You must ensure the following connectivity requirements are available:
| Source | Destination | Ports | Description |
|---|
| ESET PROTECT | Samurai Local Collector | TCP/514 (syslog) | For log transmission |
Table 1: Connectivity requirements
Syslog Configuration
Follow the steps described in Export logs to Syslog using the following parameters:
| Parameter | Value |
|---|
| Host | IP of the Samurai Local Collector |
| Port | 514 |
| Format | Syslog |
| Transport | TCP |
| Exported logs format | JSON |
For integrations that utilize a Local Collector where we ingest syslog only, you do not need to follow specific steps in the SamurAI MDR portal as we auto detect the vendor and product. The only reason you need to use the SamurAI MDR portal is if you need to determine the Local Collector IP address. Of course you will still need to ensure the integration is functioning! See Integrations for more information on checking status.
Our Integration guide was accurate at the time of writing but vendors change things frequently! If you find errors or anything is outdated, let us know by raising a request in the SamurAI MDR Portal and we shall get it updated.
8.29 - F5 BIG-IP ASM
| SamurAI [Local] Collector | SamurAI [Cloud] Collector |
|---|
| |
This guide describes the steps required to configure F5 BIG-IP Application Security Module (ASM) to send logs to a Samurai Local Collector deployed in your network.
Ensure correct network connectivity
You must ensure the following connectivity requirements are fulfilled:
| Source | Destination | Ports | Description |
|---|
| BIG-IP ASM | Samurai Local Collector | TCP/514 | For log transmission |
To send ASM logs to a Samurai Local Collector
Follow the steps outlined in the F5 documentation:
Follow each section outlined below. If you have already created a logging profile navigate to the next section:
- Creating a logging profile
- Setting up remote logging
- Associating a logging profile with a security policy
Perform the below settings adjustments as you work through the steps. In case a setting property is not referenced below, simply use the default value.
- Application Security: Application Security Checkbox (Enabled)
When enabled, additional Application Security fields will be displayed. Use the parameters outlined below when completing the additional fields:
- Remote Storage: Checkbox enabled
- Logging Format: Key-Value Pairs
- Protocol: TCP
- Server Addresses: IP address of your Samurai local collector
- Server Addresses Port: 514
- Storage Filter Request Type: All Requests
Ensure you associate the logging profile with the relevant security policy by following the steps in the F5 documentation.
For integrations that utilize a Local Collector where we ingest syslog only, you do not need to follow specific steps in the SamurAI MDR portal as we auto detect the vendor and product. The only reason you need to use the SamurAI MDR portal is if you need to determine the Local Collector IP address. Of course you will still need to ensure the integration is functioning! See Integrations for more information on checking status.
Our Integration guide was accurate at the time of writing but vendors change things frequently! If you find errors or anything is outdated, let us know by raising a request in the SamurAI MDR Portal and we shall get it updated.
8.30 - F5 BIG-IP LTM
| SamurAI [Local] Collector | SamurAI [Cloud] Collector |
|---|
| |
This guide describes the steps required to configure F5 BIG-IP Load Traffic Manager (LTM) to send logs to a Samurai Local Collector deployed in your network.
Ensure correct network connectivity
You must ensure the following connectivity requirements are fulfilled:
| Source | Destination | Ports | Description |
|---|
| BIG-IP LTM | Samurai Local Collector | TCP/514 | For log transmission |
Follow steps in F5 documentation
Perform the steps outlined in the vendor documentation to configure and implement a Request Logging profile:
Perform the below settings adjustments under the relevant section. In case a setting property is not referenced below, simply use the default value.
Creating a pool with request logging to manage HTTP traffic
- IP address of logging server: Insert the IP address of the Samurai Local Collector.
- Service Port: 514
Creating a request logging profile
- HSL Protocol: TCP
- Custom Request Settings:
BIGIP_LTM_WEB $BIGIP_HOSTNAME $VIRTUAL_NAME $NCSA_COMBINED
Configuring a request logging profile for responses
- HSL Protocol: TCP
- Custom Request Settings:
BIGIP_LTM_WEB $BIGIP_HOSTNAME $VIRTUAL_NAME $NCSA_COMBINED
For integrations that utilize a Local Collector where we ingest syslog only, you do not need to follow specific steps in the SamurAI MDR portal as we auto detect the vendor and product. The only reason you need to use the SamurAI MDR portal is if you need to determine the Local Collector IP address. Of course you will still need to ensure the integration is functioning! See Integrations for more information on checking status.
Our Integration guide was accurate at the time of writing but vendors change things frequently! If you find errors or anything is outdated, let us know by raising a request in the SamurAI MDR Portal and we shall get it updated.
8.31 - Fortinet FortiAnalyzer
| SamurAI [Local] Collector | SamurAI [Cloud] Collector |
|---|
| |
To complete this Integration you will need to:
1) Ensure Connectivity Requirements are in place
2) From the FortiAnalyzer
3) From your Fortigate devices (if using Fortigate devices)
4) From your FortiWeb devices (if using Fortiweb devices)
5) From the SamurAI Portal:
Connectivity Requirements
You must ensure the following connectivity requirements are available:
| Source | Destination | Ports | Description |
|---|
| FortiAnalyzer | Samurai Local Collector | UDP/514 (syslog) | For log transmission |
| Samurai Local Collector | FortiAnalyzer | TCP/443 (https) default or your definition | Optional (based on optional configuration in this article) |
Create a reduced restricted profile
Follow the steps outlined in the Fortinet documentation:
Use the following parameters when completing the steps:
| Profile system settings | Value |
|---|
| Profile Name | Whatever you want, however we suggest ntt_restricted_user |
| Options | Set all options to None except Log View / FortiView which should be set to Read-Only |
Follow the steps outlined in the Fortinet documentation:
Use the following required parameters when completing the steps:
| Log forward setting | Value |
|---|
| Name | Whatever you want, however we suggest NTT_collector |
| Status | On |
| Remote Server Type | Syslog |
| Server Address | IP address of your collector |
| Server Port | 514 |
| Compression | Off |
| Reliable Connection | Off |
| Sending Frequency | Real-time |
| Device Filters | Click Select Device, then select the devices whose logs will be forwarded (Note: you may have to come back to this if you are not sending logs from your Fortigate devices yet!) |
| Log filters | Off |
| Enable exclusions | Off |
| Enable Masking | Off |
Create a new administrator
Follow the steps outlined in the Fortinet documentation:
Use the following parameters when completing the steps:
| Administrator account | Value |
|---|
| User Name | Whatever you want, however we suggest ntt_user |
| Description / Comments | Whatever you want |
| Admin Type | LOCAL |
| Password | Enter a secure password, you will need this later for the integration |
| Admin Profile | Select the profile from the the previous step, we recommended ntt_restricted_user |
| Administrative Domain | Select based on your setup or use the default option, All ADOMS |
| JSON API Access | Read |
| Trusted Hosts (optional) | You can optionally restrict this account to the IP address of your Collector |
Enable FortiGate to send logs and PCAP to FortiAnalyzer
All FortiGate devices in scope must be connected to the FortiAnalyzer to send logs and PCAP.
Follow the steps outlined in the Fortinet documentation:
Use the following required parameters when completing the steps:
| Remote Logging and Archiving | Value |
|---|
| Send logs to FortiAnalyzer/FortiManager | Enable |
| Server | IP address for your FortiAnalyzer |
| Upload option | Real Time |
If this is the first time remote logging is configured and the FortiGate device was not previously added to FortiAnalyzer, the device needs to be authorized under FortiAnalyzer Device Manager to be able to upload its logs. Perform this on the FortiAnalyzer
Disk backed log buffer is recommended on Fortigates with an SSD disk.
Follow the steps outlined in the Fortinet documentation:
Follow the steps in the section entitled ‘Configuring FortiAnalyzer policies’ outlined in the Fortinet FortiWeb documentation:
Complete the Fortinet FortiAnalyzer Integration
Login to the SamurAI Portal
Click Telemetry and select Integrations from the main menu
Click Create
Find and select Fortinet FortiAnalyzer
Select the relevant Local Collector and click Next
Enter the following information
- Name for the Integration - the name will appear in the SamurAI Portal for you to easily reference
- Description - optional but if completed will appear in the SamurAI Portal for you to easily reference)
- The Username and Password you created in Create a new administrator
- Select Enable PCAP (only applicable to FortiGate devices) which was enabled in Enable FortiGate to send logs and PCAP to FortiAnalyzer
- Hostname/IP - enter FortiAnalyzer hostname or IP address
- Port (Optional) - if you have changed the default port enter the port number, if not, we default to 443
- adom (optional) - if not specified we default to “root”
Click on Finish
Our Integration guide was accurate at the time of writing but vendors change things frequently! If you find errors or anything is outdated, let us know by raising a request in the SamurAI MDR Portal and we shall get it updated.
8.32 - Fortinet FortiEDR (Cloud)
| SamurAI [Local] Collector | SamurAI [Cloud] Collector |
|---|
| |
This guide describes the steps required to configure a cloud based Fortinet FortiEDR Central Manager for telemetry data ingestion to the Samurai platform.
Follow the steps below:
1. From the FortiEDR Central Manager (Cloud)
2. From the SamurAI Portal
Create a user with a REST API role
Follow the Fortinet documentation:
When completing the steps use the following parameters:
| Attribute | Parameter |
|---|
| Role | Read-Only |
| Advanced | Rest-API (Checked) |
| Two-Factor Authentication | Ensure it is disabled |
Once you have created the user, you must use the credentials to login to the FortiEDR Central Manager and change the password before proceeding, this is due to Fortinet forcing a password reset upon first login.
You will also need to provide additional information to complete the integration. This includes:
- Deployment URL: This is the URL utilized to access the Cloud based FortiEDR Central Manager .
- Organization: This is the Organization name used when logging into the FortiEDR Central Manager
Complete the Fortinet FortiEDR Integration
- Login to the SamurAI Portal
- Click Telemetry and select Integrations from the main menu
- Select Create
- Locate and click Fortinet FortiEDR (cloud)
- Click Next (we leverage a Samurai Cloud Collector)
- Enter a Name of Integration
- Enter a Description (Optional)
- Enter your Deployment URL
- Enter your Organization
- Enter your Username
- Enter your Password
- Click Finish
Our Integration guide was accurate at the time of writing but vendors change things frequently! If you find errors or anything is outdated, let us know by raising a request in the SamurAI MDR Portal and we shall get it updated.
8.33 - Fortinet FortiEDR (On-Premise)
| SamurAI [Local] Collector | SamurAI [Cloud] Collector |
|---|
| |
This guide describes the steps required to configure an On-Premise deployed Fortinet FortiEDR Central Manager for telemetry data ingestion to the Samurai platform.
Follow the steps below:
1) Ensure Connectivity Requirements are in place
2. From the FortiEDR Central Manager (On-Premise)
3. From the SamurAI Portal
Connectivity Requirements
You must ensure the following connectivity requirements are available:
| Source | Destination | Ports | Description |
|---|
| Samurai Local Collector | FortiEDR Central Manager (On-Premise) | TCP/443 (https) | Application Programming Interface (API) access |
Create a user with a REST API role
Follow the Fortinet documentation:
When completing the steps use the following parameters:
| Attribute | Parameter |
|---|
| Role | Read-Only |
| Advanced | Rest-API (Checked) |
| Two-Factor Authentication | Ensure it is disabled |
Once you have created the user, you must use the credentials to login to the FortiEDR Central Manager (On-Premise) and change the password before proceeding, this is due to Fortinet forcing a password reset upon first login.
You will also need to provide additional information to complete the integration. This includes:
- Deployment URL: This is the URL utilized to access the On-Premise deployed FortiEDR Central Manager
- Example: https://IP address or Hostname (if hostname it must resolve to the IP address)
- Organization: This is the Organization name used when logging into the FortiEDR Central Manager (On-Premise)
Complete the Fortinet FortiEDR On-premise Integration
- Login to the SamurAI Portal
- Click Telemetry and select Integrations from the main menu
- Select Create
- Locate and click Fortinet FortiEDR (on-prem)
- Click Next
- Select the relevant Local Collector and click Next
- Enter a Name of Integration
- Enter a Description (Optional)
- Enter your Local Deployment URL - example https://IP or hostname (if hostname is used, it must be resolveable and accessible from the local collector)
- Enter your Organization
- Enter your Username
- Enter your Password
- Select the Fallback timezone - this is the timezone to assume if no epoch field exists in the data. UTC and CET (for CET/CEST) supported.
- Click Finish
Our Integration guide was accurate at the time of writing but vendors change things frequently! If you find errors or anything is outdated, let us know by raising a request in the SamurAI MDR Portal and we shall get it updated.
8.34 - Fortinet FortiGate Next-Generation Firewall
| SamurAI [Local] Collector | SamurAI [Cloud] Collector |
|---|
| |
1) Ensure Connectivity Requirements are in place
2) From FortiGate Next-Generation Firewall console:
3) If you have configured the options above, from the SamurAI Portal:
CLI commands may depend on Forti OS version. Refer to the relevant Fortinet documentation if needed.
This guide assumes that you are not using the VDOM feature.
Connectivity Requirements
You must ensure the following connectivity requirements are available:
| Source | Destination | Ports | Description |
|---|
| FortiGate NGFW | Samurai Local Collector | UDP/514 (syslog) | For log transmission |
| Samurai Local Collector | FortiGate NGFW | TCP/443 (https) default or your definition | Application Programming Interface (API) access |
Execute the CLI commands outlined in the FortiGate Next Generation Firewall documentation.
config log syslogd4 setting
   set status enable
   set server [IP address of your Samurai Collector]
   set mode udp
   set port 514
   unset source-ip
   set format default
end
config log syslogd4 filter
   set filter [see table 1]
   set filter-type include
end
The following table shows the value indicating the send log for each security function.
| Security Features | Value indicating the send log (One line each; no separator) |
|---|
| IPS/IDS Features | “ips-level(information)” |
| IPS/IDS and AntiVirus Features | “ips-level(information)virus-level(information)” |
| IPS/IDS and AntiVirus Features and Web Filter Features | “ips-level(information)virus-level(information)webfilter-level(information)” |
Table 1: Security Features Logs To Be Sent
Execute the CLI commands outlined in the FortiGate Next Generation Firewall documentation.
config firewall policy
   edit [Policy ID]
       ...
   set logtraffic [utm or all]
   set logtraffic-start disable
       ...
   next
end
config antivirus profile edit [Profile Name] ... set extended-log enable ... nextend
config webfilter profile
   edit [Profile Name]
      ...
    set log-all-url disable
    set web-content-log enable
    set web-filter-activex-log enable
    set web-filter-command-block-log enable
    set web-filter-cookie-log enable
    set web-filter-applet-log enable
    set web-filter-jscript-log enable
    set web-filter-js-log enable
    set web-filter-vbs-log enable
    set web-filter-unknown-log enable
    set web-filter-refere-log enable
    set web-filter-cookie-removal-log enable
    set web-url-log enable
    set web-invalid-domain-log enable
    set web-ftgd-err-log enable
    set web-ftgd-quota-usage enable
    set extended-log enable
    set web-extended-all-action-log enable
   next
end
config ips sensor
   edit [Sensor Name]
      ...
     set extended-log enable
        config entries
           edit [ID]
           set location all
           set severity info low
           set protocol all
           set os all
           set application all
           set status [enable or default]
            (please refer to the table below)
           set log enable
           set log-packet disable
           set log-attack-context disable
           set action [pass or block or reset or default]
            (please refer to the table below)
            ...
           next
           edit [ID]
              set location all
              set severity medium high critical
          set protocol allset os all
          set application all
          set status [enable or default]
               (please refer to the table 2)
          set log enable
          set log-packet enable
          set log-attack-context disable
          set action [pass or block or reset or default]
              (please refer to the table 2)
              ...
Tip: Ensure evaluation order of IPS sensor entries so that the above settings apply properly.
| Action | Status |
|---|
| pass or block or reset | enable |
| default | default |
Table 2: Matching Actions to Status
Execute the CLI command outlined in the FortiGate Next Generation Firewall documentation.
config ips settings set packet-log-history 5 set packet-log-post-attack 10 set ips-packet-quota 0end
After checking [HD logging space] with the following command, determine the size of [log-quota] with the following calculation:
[log-quota] = [Total HD logging space] / 2
[log-quota] should be rounded down to the nearest thousand. In the following example, the [log-quota] is 88000.
diagnose sys logdisk usage
Total HD usage: 236286 MB/333 MB
Total HD logging space: 177214 MB
HD logging space usage for vdom "root": 106 MB/177214 MB
Execute the CLI command outlined in the FortiGate Next Generation Firewall documentation.
config log disk setting
   set status enable
   set ips-archive enable
   set max-policy-packet-capture-size 100
   set log-quota [calculated value above,for example here, 88000]
   set maximum-log-age 5
   set full-first-warning-threshold 75
   set full-second-warning-threshold 90
   set full-final-warning-threshold 95
   set max-log-file-size 20
   set roll-schedule daily
   set diskfull overwrite
...
Follow the steps outlined in the FortiGate Next Generation Firewall documentation.
Use the following parameters when completing the deployment:
| Field Name | Parameter |
|---|
| Name | Whatever you want, however we suggest: api_admin |
| Data Access | Read |
Table 3: Administrator Profile
Use the following parameters when completing the deployment:
| Field Name | Parameter |
|---|
| Username | Whatever you want, however we suggest: api_user |
| Administrator Profile | Add your administrator profile created above (we suggested api_admin) |
| Trusted Hosts | IP Address of your Samurai Local Collector |
Table 4: REST API Admin
Complete the Fortinet FortiGate Next-Generation Firewall Integration
Login to the SamurAI Portal
Click Telemetry and select Integrations from the main menu
Click Create
Find and select Fortinet FortiGate Next-Generation Firewall
Select the relevant Local Collector and click Next
You will be presented with the Local Collector IP Address on the left of the screen
To configure Extended Telemetry Collection ensure it is enabled via the toggle
Enter the following information:
- Name for the Integration - the name will appear in the SamurAI Portal for you to easily reference
- Description - optional but if completed will appear in the SamurAI Portal for you to easily reference)
- Devicename - an arbitrary name to identify the Fortinet device
- API-Key - you generated under Create new Rest API Admin
- Select Enable PCAP
- Hostname/IP - hostname or IP address of Fortinet device to collect alerts from
- Port - if you have changed the default port enter the port number, if not, we default to 443
Click on Finish
Our Integration guide was accurate at the time of writing but vendors change things frequently! If you find errors or anything is outdated, let us know by raising a request in the SamurAI MDR Portal and we shall get it updated.
8.35 - Fortinet FortiWeb
| SamurAI [Local] Collector | SamurAI [Cloud] Collector |
|---|
| |
This guide describes the steps required to configure Fortinet FortiWeb to send logs to a Samurai Local Collector deployed on your network. FortiWeb requires access to the Local Collector via syslog on port 514/UDP.
If you have deployed a FortiAnalyzer, please refer to the Fortinet FortiAnalyzer integration guide.
1) From FortiWeb console:
We reference version 7.0.4 documentation, be sure to select the version applicable to your FortiWeb.
Follow the steps outlined in the section entitled ‘Configuring Syslog settings’ located within the Fortinet documentation:
Use the parameters defined in the table below for each field:
| Field Name | Parameter |
|---|
| Policy Name | Whatever you like, however we recommend ntt_syslog_policy |
| IP Address (remote syslog server) | IP address of your Local Samurai Collector |
| Port | 514 |
| Format | Default |
| Enable TLS | disabled |
Table 1 - Syslog settings
Follow the steps outlined in the section entitled ‘Configuring triggers’ within the Fortinet documentation:
Use the parameters defined in the table below for each field:
| Field Name | Parameter |
|---|
| Name | Whatever you like, however we recommend ntt_syslog_trigger |
| Syslog Policy | We recommended ntt_syslog_policy |
Table 2 - Trigger policy
Follow the steps outlined in the section entitled ‘Configure log destinations’ within the Fortinet documentation:
Use the parameter defined in the table below for each field:
| Field Name | Parameter |
|---|
| Global Log Setting | Enable Syslog |
| Syslog Policy | We recommended ntt_syslog_policy |
| Log Level | Information |
| Facility | leave as default (reserved for local use 7) |
Table 3 - Log destination
Enable log types
Follow the steps outlined within the Fortinet documentation:
Use the parameter defined in the table below for each field:
| Field Name | Parameter |
|---|
| Other Log Settings | Enable the following:
Enable Attack Log
Enable Traffic Log
Enable Event Log (Optional) |
| System Alert Thresholds | Keep default values for all (CPU Utilization, Memory Utilization, Log Disk Utilization) |
| Trigger Policy | We recommended ntt_syslog_trigger |
Table 4 - Log types
For integrations that utilize a Local Collector where we ingest syslog only, you do not need to follow specific steps in the SamurAI MDR portal as we auto detect the vendor and product. The only reason you need to use the SamurAI MDR portal is if you need to determine the Local Collector IP address. Of course you will still need to ensure the integration is functioning! See Integrations for more information on checking status.
Our Integration guide was accurate at the time of writing but vendors change things frequently! If you find errors or anything is outdated, let us know by raising a request in the SamurAI MDR Portal and we shall get it updated.
8.36 - GestioIP IPAM
| SamurAI [Local] Collector | SamurAI [Cloud] Collector |
|---|
| |
This guide describes the steps required to configure GestioIP IP Address Management (IPAM) asset information retrieval from a Samurai Local Collector deployed in your network.
The API access used by this integration requires the commercial edition of GestioIP.
This integration only provides contextual data for use by the Samurai MDR SOC. No data from this integration will be visible in the SamurAI Portal.
Connectivity Requirements
| Source | Destination | Ports | Description |
|---|
| Samurai Local Collector | GestioIP IPAM | TCP/443 (HTTPS) | API access |
Create GestioIP User
Follow the steps outlined in section 8.1.1.1 GestioIP Documentation to create a local user or section 8.1.2.2 if using LDAP.
If using the authorization feature of GestioIP, ensure that the created user is added to the Read Only default group.
Complete the GestioIP IPAM Integration
- Login to the SamurAI Portal
- Click Telemetry and select Integrations from the main menu
- Select Create
- Locate and click GestioIP IPAM
- Select a Samurai Local Collector
- Enter the URL to your GestioIP instance
- Enter User and Password as created in Creating GestioIP User
- Click Finish
Our Integration guide was accurate at the time of writing but vendors change things frequently! If you find errors or anything is outdated, let us know by raising a request in the SamurAI MDR Portal and we shall get it updated.
8.37 - Google Workspace
| SamurAI [Local] Collector | SamurAI [Cloud] Collector |
|---|
| |
To complete this Integration you will need to perform steps in both Google Workspace and the SamurAI Portal.
Follow the steps below:
1. From Google Workspace
2. From the SamurAI Portal
Enable the Admin SDK API
Follow the Google API Console Help documentation:
A Google API Console project is required and will be created during the steps.
Ensure you login to the Google Console as a super administrator and use the following parameters when completing the steps:
| Documentation Step | Field Name | Parameter |
|---|
| 2 | Project Name | Anything you want but we recommend “SamuraiAPI” |
| 2 | Organization | The name of your organization |
| 2 | Location | Anything you want |
| 4 | API Library | Select and enable against the project created in Step 2:
“Admin SDK API”
“Google Workspace Alert Center API” |
Review the
API Console Help pages if you require more information on Google APIs.
Create a service account
Follow the steps outlined within the Google documentation:
Ignore the optional steps 4 and 6 when creating the service account.
Use the following parameters when completing the steps:
| Documentation Step | Field Name | Parameter |
|---|
| 3 | Service Account Name | Anything you want but we recommend “SamuraiAPI” |
| 3 | Service Account ID | Anything you want but we recommend “SamuraiAPI” |
| 3 | Service Account Description | Anything you want but we recommend “SamuraiAPI” |
Create credentials for the service account
Follow the steps outlined within the Google documentation:
Delegate domain-wide authority to the service account
Follow the steps outlined within the Google documentation:
Use the following parameters when completing the steps:
Complete the Google Workspace integration
You will need:
- Login to the SamurAI Portal
- Click Telemetry and select Integrations from the main menu
- Select Create
- Locate and click Google Workspace
- Click Next (we leverage a Samurai Cloud Collector)
- Enter a Name of Integration
- Enter a Description (Optional)
- Enter your Service Account JSON (copy and paste from the json file you downloaded)
- Enter your Domain-Wide delegation account (the admin account email used for domain-wide delegation)
- Click Finish
Our Integration guide was accurate at the time of writing but vendors change things frequently! If you find errors or anything is outdated, let us know by raising a request in the SamurAI MDR Portal and we shall get it updated.
8.38 - Heimdal Security
| SamurAI [Local] Collector | SamurAI [Cloud] Collector |
|---|
| |
The current Heimdal Security API provides a single timestamp of events based on the endpoint. If there are any delays in the endpoint transmitting events to Heimdal or if the endpoint time is out of sync may result with events not being ingested into the Samurai platform. We have made concessions to work around the limitation however we cannot guarantee that all events will be ingested into the Samurai platform.
To complete this Integration you will need to:
1) From the Heimdal Security Dashboard
2) From the SamurAI Portal
Create a Heimdal Dashboard Account
Follow the steps outlined in the Heimdal Security documentation:
This account will only be used for API access from the Samurai platform therefore ensure you utilize appropriate credentials that you will manage. We recommend populating only the minimum fields required and not enabling reports and alerts whilst ensuring the account is activated under Miscellaneous Settings.
When creating the account you must ensure the timezone is set to UTC+00:00 and must not be changed.
Create a Personal API Key
Follow the steps outlined in the Heimdal Security documentation:
Take note of the Customer ID and select Copy key as you will need this to Complete the Heimdal Security Integration
Complete the Heimdal Security Integration
You will need:
- Login to the SamurAI Portal
- Click Telemetry and select Integrations from the main menu
- Click Create
- Find and select Heimdal Security
- Enter a Name of Integration
- Enter a Description (Optional)
- Enter the CustomerID
- Enter the API Key
- Click on Finish
Our Integration guide was accurate at the time of writing but vendors change things frequently! If you find errors or anything is outdated, let us know by raising a request in the SamurAI MDR Portal and we shall get it updated.
8.39 - Infoblox DDI
| SamurAI [Local] Collector | SamurAI [Cloud] Collector |
|---|
| |
This guide describes the steps required to configure an on-premise Infoblox DNS, DHCP & IP Address Management (DDI) device to send logs to a Samurai Local Collector deployed in your network.
To complete this Integration you will need to:
- Ensure correct network connectivity
- Perform Grid Configuration
- Perform Data Management Configuration
Ensure correct network connectivity
You must ensure the following connectivity requirements are fulfilled:
| Source | Destination | Ports | Description |
|---|
| Infoblox DDI | Samurai Local Collector | TCP/514 | For log transmission |
Perform the steps outlined in the vendor documentation to add an external syslog server:
Perform the below settings adjustments. In case a setting property is not referenced below, simply use the default value:
- Address: Insert the IP address of the Samurai Local Collector.
- Transport: Select TCP.
- Node ID: Select Host Name.
- Severity: Select Info.
- Logging Category: Select Send selected categories and then enable all logging categories.
This is performed to enable
prefixing of the log messages instead of using the
Send all option when configuring *Send selected categories.
Perform the steps outlined in the vendor documentation to configure DNS logging categories:
Perform the below settings adjustments. In case a setting property is not referenced below, simply use the default value:
- Logging Category: Select all the available categories.
For integrations that utilize a Local Collector where we ingest syslog only, you do not need to follow specific steps in the SamurAI MDR portal as we auto detect the vendor and product. The only reason you need to use the SamurAI MDR portal is if you need to determine the Local Collector IP address. Of course you will still need to ensure the integration is functioning! See Integrations for more information on checking status.
Our Integration guide was accurate at the time of writing but vendors change things frequently! If you find errors or anything is outdated, let us know by raising a request in the SamurAI MDR Portal and we shall get it updated.
8.40 - Linux Authentication
| SamurAI [Local] Collector | SamurAI [Cloud] Collector |
|---|
| |
This guide describes the steps required to configure Linux hosts to send authentication logs to a Samurai Local Collector deployed on your network by configuring rsyslog.
Connectivity Requirements
You must ensure the following connectivity requirements are available:
| Source | Destination | Ports | Description |
|---|
| Linux Host | Samurai Local Collector | TCP/514 (syslog) | For log transmission |
Table 1: Connectivity requirements
Follow the below steps to configure rsyslog to forward authentication events.
Rsyslog prerequisites
Ensure the following statement is included in the main rsyslog configuration file, normally located at /etc/rsyslog.conf:
$IncludeConfig /etc/rsyslog.d/*.conf
If no IncludeConfig statement exist for the /etc/rsyslog.d/ directory, append it to the end of rsyslog.conf.
Create /etc/rsyslog.d/ntt_auth.conf
Create /etc/rsyslog.d/ntt_auth.conf and insert the below configuration block, enter the Local Collector IP in the Target field.
template(
  name = "linux-auth"
  type = "string"
  string = "<%PRI%>1 %TIMESTAMP:::date-rfc3339% %HOSTNAME% %APP-NAME% %PROCID% linux_auth %STRUCTURED-DATA% %msg%"
)

if ($syslogfacility-text == "auth" or $syslogfacility-text == "authpriv") then {
  action(
    queue.type="LinkedList"
    queue.size="10000"
    type="omfwd"
    template="linux-auth"
    Target="<Local Collector IP>"
    Port="514" Protocol="tcp")
}
Validate and restart service
Confirm that rsyslog can parse the configuration without any errors by running:
rsyslogd -N1
Then restart the rsyslog service:
sudo systemctl restart rsyslog
The authentication messages will now be forwarded to the Samurai Local Collector.
For integrations that utilize a Local Collector where we ingest syslog only, you do not need to follow specific steps in the SamurAI MDR portal as we auto detect the vendor and product. The only reason you need to use the SamurAI MDR portal is if you need to determine the Local Collector IP address. Of course you will still need to ensure the integration is functioning! See Integrations for more information on checking status.
Our Integration guide was accurate at the time of writing but vendors change things frequently! If you find errors or anything is outdated, let us know by raising a request in the SamurAI MDR Portal and we shall get it updated.
8.41 - Microsoft 365 (formerly Office365)
| SamurAI [Local] Collector | SamurAI [Cloud] Collector |
|---|
| |
This integration collects audit and activity data from Microsoft 365 tenants using Microsoft’s unified audit logging capability and Management Activity API.
To complete this Integration you will need to:
1) Within Microsoft 365:
2) From the SamurAI Portal:
Ensure Microsoft 365 auditing is enabled
Audit logging is enabled by default for Microsoft 365 enterprise tenants. However, when setting up a new tenant, you should verify that audit logging is enabled before proceeding.
Follow the steps outlined within the Microsoft documentation to ensure audit logging is enabled:
Verify that Azure Exchange Mailbox Auditing is Enabled
This is only necessary if monitoring Azure Exchange.
Azure Exchange Mailbox Auditing is enabled by default however verify this by following the Microsoft documentation:
Register application with Azure Active Directory
Follow the steps outlined within the Microsoft documentation:
Use the following parameters when completing the steps:
| Field Name | Parameter |
|---|
| Name of app | Whatever you want, however we suggest NTT_app |
| Supported Account Types | Select Accounts in this organizational directory only (single tenant) |
| Redirect URI | Not required |
Table 1: App registration
Generate Application Secret Key
Follow the steps within the Microsoft documentation:
Use the following parameters when completing the steps:
| Field Name | Parameter |
|---|
| Description | Whatever you want, however we suggest NTT_app |
| Expires | The expiration period will depend on your company’s security policies. It will be your responsibility to create a new key should it expire and update the Integration when you Complete the Microsoft 365 Integration |
| Redirect URI | Not required |
Table 2: Secret key
Specify permissions for the app
Follow the steps within the Microsoft documentation:
Use the following parameters when completing the steps:
| Field Name | Parameter |
|---|
| Request API permissions | Application permissions |
| Permissions | ActivityFeed.Read
ActivityFeed.ReadDlp
ServiceHealth.Read |
Table 3: App permissions
Complete the Microsoft 365 Integration
You will need:
- Login to the SamurAI Portal
- Click Telemetry and select Integrations from the main menu
- Select Create
- Locate and click Microsoft 365
- Click Next (we leverage a Samurai Cloud Collector)
- Enter a Name of Integration
- Enter a Description (Optional)
- Enter your Application (client) ID
- Enter your Directory (tenant) ID
- Enter your Secret Key (client Secret)
- Click Finish
Our Integration guide was accurate at the time of writing but vendors change things frequently! If you find errors or anything is outdated, let us know by raising a request in the SamurAI MDR Portal and we shall get it updated.
8.42 - Microsoft Azure Activity Logs
| SamurAI [Local] Collector | SamurAI [Cloud] Collector |
|---|
| |
This guide describes the steps required to configure Microsoft Azure to send Activity Logs to a Storage account for ingestion to Samurai via a cloud collector.
Ensure that a cloud collector has been deployed via the SamurAI Portal.
The storage account created via the cloud collector needs to reside in the same region as the telemetry sources which will be ingested into the Samurai platform. For ingesting telemetry from multiple regions you need to create additional cloud collector(s) for each region.
Take note of the name of the storage account created and which subscription it resides in. This will be used later when setting up the telemetry sources.
If you are planning to reuse an already deployed cloud collector, the information about the created storage account and subscription can be found via:
- Navigate to the SamurAI Portal.
- Click Telemetry and select Collectors from the main menu
- Click on the name of the desired collector.
- Note down information about the:
- Subscription
- Storage account name
Alternatively, you can utilize the integration setup wizard via the SamurAI Portal for the desired telemetry source listed on Product Integration Guide page which shall provide you the same information required to setup your telemetry source.
Enabling Azure Activity logs
Follow the vendor documentation guide to enable Microsoft Azure Activity logs.
When following the vendor documentation, please perform the following adjustments:
Select the following log categories
Ensure when configuring the Storage Account setting that it’s referencing the storage account that was setup during the creation of the cloud collector.
Ensure the retention period aligns with your storage policies however we recommend at minimum 7 days.
Our Integration guide was accurate at the time of writing but vendors change things frequently! If you find errors or anything is outdated, let us know by raising a request in the SamurAI MDR Portal and we shall get it updated.
8.43 - Microsoft Azure Application Gateway
| SamurAI [Local] Collector | SamurAI [Cloud] Collector |
|---|
| |
This guide describes all steps required to configure Microsoft Azure Application Gateway to send logs to a Storage account for ingestion to Samurai via a cloud collector.
Ensure that a cloud collector has been deployed via the SamurAI Portal.
The storage account created via the cloud collector needs to reside in the same region as the telemetry sources which will be ingested into the Samurai platform. For ingesting telemetry from multiple regions you need to create additional cloud collector(s) for each region.
Take note of the name of the storage account created and which subscription it resides in. This will be used later when setting up the telemetry sources.
If you are planning to reuse an already deployed cloud collector, the information about the created storage account and subscription can be found via:
- Navigate to the SamurAI Portal.
- Click Telemetry and select Collectors from the main menu
- Click on the name of the desired collector.
- Note down information about the:
- Subscription
- Storage account name
Alternatively, you can utilize the integration setup wizard via the SamurAI Portal for the desired telemetry source listed on Product Integration Guide page which shall provide you the same information required to setup your telemetry source.
Follow the vendor documentation guide to enable Azure Application Gateway logs through the Azure Portal:
When following the vendor documentation, please perform the following adjustments:
Select the following log categories
- ApplicationGatewayAccessLogs
- ApplicationGatewayFirewallLogs
Ensure when configuring the Storage Account setting that it’s referencing the storage account that was setup during the creation of the cloud collector.
Ensure the retention period aligns with your storage policies however we recommend at minimum 7 days.
Our Integration guide was accurate at the time of writing but vendors change things frequently! If you find errors or anything is outdated, let us know by raising a request in the SamurAI MDR Portal and we shall get it updated.
8.44 - Microsoft Azure Firewall
| SamurAI [Local] Collector | SamurAI [Cloud] Collector |
|---|
| |
This guide describes the steps required to configure a Microsoft Azure Firewall to send logs to a Storage account for ingestion to Samurai via a cloud collector.
Prerequisites
Ensure that a cloud collector has been deployed via the SamurAI Portal.
The storage account created via the cloud collector needs to reside in the same region as the telemetry sources which will be ingested into the Samurai platform. For ingesting telemetry from multiple regions you need to create additional cloud collector(s) for each region.
Take note of the name of the storage account created and which subscription it resides in. This will be used later when setting up the telemetry sources.
If you are planning to reuse an already deployed cloud collector, the information about the created storage account and subscription can be found via:
- Navigate to the SamurAI Portal.
- Click Telemetry and select Collectors from the main menu
- Click on the name of the desired collector.
- Note down information about the:
- Subscription
- Storage account name
Alternatively, you can utilize the integration setup wizard via the SamurAI Portal for the desired telemetry source listed on Product Integration Guide page which shall provide you the same information required to setup your telemetry source.
Enabling Azure Firewall logs
Follow the vendor documentation guide to enable Microsoft Azure Firewall logs.
When following the vendor documentation, please perform the following adjustments:
Select the following log categories
- Network Rule
- Application Rule
- Nat Rule
- Threat Intelligence
- IDPS Signature
- DNS query
Ensure when configuring the Storage Account setting that it’s referencing the storage account that was setup during the creation of the cloud collector.
Ensure the retention period aligns with your storage policies however we recommend at minimum 7 days.
Our Integration guide was accurate at the time of writing but vendors change things frequently! If you find errors or anything is outdated, let us know by raising a request in the SamurAI MDR Portal and we shall get it updated.
8.45 - Microsoft Azure Key Vault
| SamurAI [Local] Collector | SamurAI [Cloud] Collector |
|---|
| |
This guide describes the steps required to configure Microsoft Azure to send Azure Key Vault logs to a Storage account for ingestion to Samurai via a cloud collector.
Ensure that a cloud collector has been deployed via the SamurAI Portal.
The storage account created via the cloud collector needs to reside in the same region as the telemetry sources which will be ingested into the Samurai platform. For ingesting telemetry from multiple regions you need to create additional cloud collector(s) for each region.
Take note of the name of the storage account created and which subscription it resides in. This will be used later when setting up the telemetry sources.
If you are planning to reuse an already deployed cloud collector, the information about the created storage account and subscription can be found via:
- Navigate to the SamurAI Portal.
- Click Telemetry and select Collectors from the main menu
- Click on the name of the desired collector.
- Note down information about the:
- Subscription
- Storage account name
Alternatively, you can utilize the integration setup wizard via the SamurAI Portal for the desired telemetry source listed on Product Integration Guide page which shall provide you the same information required to setup your telemetry source.
Enabling Azure Key Vault logs
Follow the vendor documentation guide to enable Azure Key Vault logging:
When following the documentation, please perform the following adjustments:
Select the following log categories
Ensure when configuring the Destination Details to select Archive to storage account. When selecting the Storage Account ensure it references the storage account that was setup during the creation of the cloud collector.
Our Integration guide was accurate at the time of writing but vendors change things frequently! If you find errors or anything is outdated, let us know by raising a request in the SamurAI MDR Portal and we shall get it updated.
8.46 - Microsoft Defender Advanced Hunting
| SamurAI [Local] Collector | SamurAI [Cloud] Collector |
|---|
| |
This guide describes the steps required to configure Microsoft Defender to send Advanced Hunting Logs to a Storage account for ingestion to Samurai via a cloud collector.
Ensure that a cloud collector has been deployed via the SamurAI Portal.
The storage account created via the cloud collector needs to reside in the same region as the telemetry sources which will be ingested into the Samurai platform. For ingesting telemetry from multiple regions you need to create additional cloud collector(s) for each region.
Take note of the name of the storage account created and which subscription it resides in. This will be used later when setting up the telemetry sources.
If you are planning to reuse an already deployed cloud collector, the information about the created storage account and subscription can be found via:
- Navigate to the SamurAI Portal.
- Click Telemetry and select Collectors from the main menu
- Click on the name of the desired collector.
- Note down information about the:
- Subscription
- Storage account name
Alternatively, you can utilize the integration setup wizard via the SamurAI Portal for the desired telemetry source listed on Product Integration Guide page which shall provide you the same information required to setup your telemetry source.
Enabling Defender Advanced Hunting Logs
Follow the vendor documentation guide to enable Advanced Hunting Logs data streaming to blob storage.
Stream Microsoft Defender XDR events to your storage account
Ensure when configuring the Storage Account setting that it’s referencing the resource ID for the storage account that was setup during the creation of the cloud collector.
Recommended event types to stream for endpoint related data are
- DeviceEvents
- DeviceFileEvents
- DeviceImageLoadEvents
- DeviceLogonEvents
- DeviceNetworkEvents
- DeviceProcessEvents
- DeviceRegistryEvents
Our Integration guide was accurate at the time of writing but vendors change things frequently! If you find errors or anything is outdated, let us know by raising a request in the SamurAI MDR Portal and we shall get it updated.
8.47 - Microsoft DHCP Server
| SamurAI [Local] Collector | SamurAI [Cloud] Collector |
|---|
| |
Use this document to install and configure the Filebeat agent to send Microsoft DHCP Server logs to Samurai using the Samurai Local Collector deployed in your network.
To complete this Integration you will need to:
- Ensure correct network connectivity
- Download & Install Filebeat
- Configure & Enable DHCP Server Audit Logging
- Configure & Start Filebeat
This guide is based on the premise of a single Samurai Local Collector installation with deployment of a single Windows host with the DHCP Server service enabled and configured. Repeat these steps outlined in this guide for each Microsoft DHCP Server and site.
Ensure correct network connectivity
You must ensure the following connectivity requirements are fulfilled:
| Source | Destination | Ports | Description |
|---|
| Microsoft DHCP Server Host | Samurai Local Collector | TCP/5044 | For log transmission |
Download & Install Filebeat
Perform the steps outlined in Step 1: Install Filebeat as per the vendor documentation.
Make sure to click the Windows tab for OS selection.
DHCP Server Audit Logging should be enabled by default and these steps are used to validate that logging is enabled and determine the logging path.
To view the DHCP Audit logging config, run the command Get-DhcpServerAuditLog.
PS C:\> Get-DhcpServerAuditLogPath : C:\Windows\system32\dhcpEnable : TrueMaxMBFileSize : 70DiskCheckInterval : 50MinMBDiskSpace : 20
Verify that the flag Enabled is set to True.
In case logging is not enabled, run the commend Set-DhcpServerAuditLog. Example command with arguments is presented below.
PS C:\> Set-DhcpServerAuditLog -Enable $True -Path C:\dhcp
The DHCP server needs to be restarted after logging has been enabled, run the following command to restart the service.
PS C:\> Restart-Service DHCPServer
Note down the file path that has been configured, this will be used later in the section Configure & Start Filebeat.
- Access the Filebeat installation folder and open and edit the file filebeat.yml.
- Modify the below template by replacing the section IP_OF_LOCAL_COLLECTOR with the IP address of the Samurai Local Collector.
- Modify the paths section of the template to use the path that was configured for the DHCP Server Audit log file location from Configure & Enable DHCP Server Audit Logging.
# ============================== Filebeat inputs ===============================
filebeat.inputs:
  - type: filestream
    id: win_dhcp
    enabled: true
    paths:
      - 'C:\Windows\System32\dhcp\Dhcp*'
    include_lines: ['^\d+,(\d+\/){2}\d+,.*$']
    tags: [win_dhcp_server]
#------------------------------ Logstash Output -------------------------------
output.logstash:
  hosts: ["IP_OF_LOCAL_COLLECTOR:5044"]
- Replace the default configuration of filebeat.yml with the modified template and save the file.
- Perform the steps outlined in Step 5: Start Filebeat as per the vendor documentation to start the service.
Make sure to click the Windows tab for OS selection.
Our Integration guide was accurate at the time of writing but vendors change things frequently! If you find errors or anything is outdated, let us know by raising a request in the SamurAI MDR Portal and we shall get it updated.
8.48 - Microsoft DNS Server
| SamurAI [Local] Collector | SamurAI [Cloud] Collector |
|---|
| |
Use this document to install and configure the Filebeat agent to send Microsoft DNS Server logs to Samurai using the Samurai Local Collector deployed in your network.
To complete this Integration you will need to:
- Ensure correct network connectivity
- Download & Install Filebeat
- Configure & Enable Microsoft DNS Server Debug Logging
- Configure & Start Filebeat
This guide is based on the premise of a single Samurai Local Collector installation with deployment of a single Windows host with the DNS Server service enabled and configured. Repeat these steps outlined in this guide for each Microsoft DNS Server and site.
Ensure correct network connectivity
You must ensure the following connectivity requirements are fulfilled:
| Source | Destination | Ports | Description |
|---|
| Microsoft DNS Server Host | Samurai Local Collector | TCP/5044 | For log transmission |
Download & Install Filebeat
Perform the steps outlined in Step 1: Install Filebeat as per the vendor documentation.
Make sure to click the Windows tab for OS selection.
All steps up until Step 4 can be ignored if DNS Server debug logging have already been enabled and configured.
Follow the steps outlined in To select and enable debug logging options on the DNS server as per the vendor documentation.
Configure Packet direction & Packet Contents*.*
- Keep default configuration or follow the minimum requirement below.
- Minimum requirement is to enable logging for Outgoing Response.

Figure 1 – Example of default configuration once “Log packets for debugging” has been enabled.
Configure an appropriate log location and name of the log file as well as a suitable Maximum Size (bytes) according to your system needs.
Note down the file path that has been configured, this will be used later in the section Configure & Start Filebeat.
- Access the Filebeat installation folder and open and edit the file filebeat.yml.
- Modify the below template by replacing the section IP_OF_LOCAL_COLLECTOR with the IP address of the Samurai Local Collector.
- Modify the paths section of the template to use the path that was configured for the DNS Server debug log file location from Configure & Enable Microsoft DNS Server Debug Logging.
# ============================== Filebeat inputs ===============================
filebeat.inputs:
  - type: filestream
    id: win_dns_server
    enabled: true
    paths:
      - 'C:\dns_logs\*'
    include_lines: ['^\d{1,4}.\d{1,2}.\d{1,4}\s.*?$']
    tags: [win_dns_server]
# ------------------------------ Logstash Output -------------------------------
output.logstash:
  hosts: ["IP_OF_LOCAL_COLLECTOR:5044"]
- Replace the default configuration of filebeat.yml with the modified template and save the file.
- Perform the steps outlined in Step 5: Start Filebeat as per the vendor documentation to start the service.
Make sure to click the Windows tab for OS selection.
Our Integration guide was accurate at the time of writing but vendors change things frequently! If you find errors or anything is outdated, let us know by raising a request in the SamurAI MDR Portal and we shall get it updated.
8.49 - Microsoft Entra ID
| SamurAI [Local] Collector | SamurAI [Cloud] Collector |
|---|
| |
This guide describes the steps required to configure a Microsoft Entra ID to send logs to a Storage account for ingestion to Samurai via a cloud collector.
Prerequisites
Ensure that a cloud collector has been deployed via the SamurAI Portal.
The storage account created via the cloud collector needs to reside in the same region as the telemetry sources which will be ingested into the Samurai platform. For ingesting telemetry from multiple regions you need to create additional cloud collector(s) for each region.
Take note of the name of the storage account created and which subscription it resides in. This will be used later when setting up the telemetry sources.
If you are planning to reuse an already deployed cloud collector, the information about the created storage account and subscription can be found via:
- Navigate to the SamurAI Portal.
- Click Telemetry and select Collectors from the main menu
- Click on the name of the desired collector.
- Note down information about the:
- Subscription
- Storage account name
Alternatively, you can utilize the integration setup wizard via the SamurAI Portal for the desired telemetry source listed on Product Integration Guide page which shall provide you the same information required to setup your telemetry source.
Enabling Entra ID activity logs
Follow the vendor documentation guide to archive Microsoft Entra logs to an Azure storage account:
When following the vendor documentation, please perform the following adjustments:
Select the following log categories
- AuditLogs
- SignInLogs
- NonInteractiveUserSignInLogs
- ServicePrincipalSignInLogs
- ManagedIdentitiySignInLogs
- ProvisioningLogs
- ADFSSignInLogs
- UserRiskEvents
- ServicePrincipalRiskEvents
- MicrosoftGraphActivityLogs
- MicrosoftServicePrincipalSignInLogs
- AzureADGraphActivityLogs
Please note NonInteractiveUserSignInLogs may cause high log volume
Ensure when configuring the Storage Account setting that it’s referencing the storage account that was setup during the creation of the cloud collector.
Ensure the retention period aligns with your storage policies however we recommend at minimum 7 days.
Our Integration guide was accurate at the time of writing but vendors change things frequently! If you find errors or anything is outdated, let us know by raising a request in the SamurAI MDR Portal and we shall get it updated.
8.50 - Microsoft Graph (Security)
| SamurAI [Local] Collector | SamurAI [Cloud] Collector |
|---|
| |
Supported Microsoft Security products
The Microsoft Graph Security API supports collection of alerts for multiple Microsoft Security products. An updated list can be found in the Microsoft documentation. Support for the following products has been validated by Samurai MDR:
- Microsoft Entra ID Protection
- Microsoft 365 Defender
- Microsoft Defender for Cloud Apps
- Microsoft Defender for Endpoint
- Microsoft Defender for Identity
- Microsoft Defender for Office 365
- Microsoft Defender for Cloud
Prerequisites
The user must have Global administrative access to the Microsoft 365 Defender and Microsoft Azure Portal.
You must have an Microsoft Entra ID P2 plan for the Privileged Identity Management features discussed below.
Recommended Advanced Settings for Defender for Endpoint
If you are a customer with the Incident Response (IR) Retainer, in order to ensure an optimal service delivery and a quick turnaround from activation to remediation by the NTT Incident Response team the below features are recommended to be enabled in Defender for Endpoint:
- Live response
- Live response for servers
- Live response unsigned script execution
Follow the Microsoft documentation - Configure advanced features in Defender for Endpoint to enable the features.
To complete this Integration you will need to perform actions in both the Azure Portal and SamurAI Portal:
1. Azure Portal
2. From the SamurAI Portal
Application Registration
- Follow the steps outlined within section entitled Register an application in the Microsoft Graph API documentation using the following parameters.
| Field Name | Parameter |
|---|
| Supported account type | Accounts in this organizational directory only |
| Redirect URL | Leave blank |
After creating the App Registration, record the Application (client) ID and Directory (tenant) ID.
- Follow the steps outlined within section entitled Add a client secret in the Microsoft Graph API documentation.
Record the secret value as this is only shown once.
- Follow the steps outlined within section entitled Configure permissions for Microsoft Graph in the Microsoft Graph API documentation. Select the following permissions.
SecurityAlert.Read.All
Remember to grant administrator consent after selecting permissions.
Enable the Samurai MDR SOC access to Microsoft 365 Defender
The steps outlined below are required for the Samurai SOC to perform remote isolation and further analysis through the Microsoft 365 Defender portal. You may also wish to refer to the Microsoft documentation - Granting managed security service provider (MSSP) access
Prerequisites
Ensure role-based access control (RBAC) is enabled in your Microsoft Defender Security Center.
To enable RBAC in Microsoft Defender Security Center, navigate to Settings > Permissions > Roles and Turn on roles from a user account with Global Administrator or Security Administrator rights.
This feature also requires an Entra ID P2 plan for the Privileged Identity Management feature.
Create an Entra ID Group and assign role
To create an Entra ID group for NTT, perform the following steps:
Log in to Entra ID admin center
Navigate to Groups > All groups > New group
Select Security from the Group type list
Ensure that Microsoft Entra roles can be assigned to the group is set to Yes
You cannot change this setting later, so make sure it is enabled. If you do not see this option, check that you have an Entra ID P2 license and have the preview features enabled.
After creating the group, follow the steps in Assign Microsoft Entra roles to groups to assign the Security Reader role to the newly created group.
Add NTT as Connected Organization
Perform the following steps to add NTT as a connected organization:
- Navigate to Identity Governance
- Click Connected organizations
- Click Add connected organization
- On the Basics tab*,* specify a Name and Description
- On the Directory + domain tab, perform the following steps:
- Click Add directory + domain
- In the Select directories + domains field, search for security.ntt

Create a Resource Catalog
In the Entra ID portal under Identity Governance perform the following steps:
- Navigate to the Catalogs tab
- Click New catalog
- Specify a Name and Descriptions, keep other values default
- Click Create
Create an Access Package
An access package enables you to do a one-time set up of resources and policies that automatically administers access for the life of the access package.
To create a new access package, perform the following steps:
Navigate to Identity Governance
Click Access packages
Click New access package
Specify a Name and Description*,* select the Catalog created in the previous step
In the Resource roles tab, add the group created in previously and set Role to Member
In the Requests tab, ensure the following options are set (leave other settings as default):
Set Users who can request access to For users not in your directory
Under Select connected organizations, select NTT
Set Require approval to Yes
Under First Approver, add at least one fallback approver
Set Enable new requests to Yes
In the Lifecycle tab, set Access Reviews to No
After creating the access package provide the My Access portal link to NTT.
Sponsors are the people responsible for approving requests made by NTT staff. You may define internal and/or external sponsors.
Internal sponsors are select individuals from within your organization who can approve requests from NTT. External sponsors are select individuals from within NTT who can approve these on your behalf.
NTT recommends selecting external sponsors and obtaining a list of names during the MDR Onboarding. These names include managers and team leads who support the service.
Setting up sponsors is a time-consuming process as it requires approving access requests from NTT staff. Therefore, NTT recommends you define external sponsors to enable NTT to manage this process.
Initial NTT users will need to be approved by the selected Fallback approvers, after which they can be added as external sponsors.
To add external sponsors, select the Connected Organization and then Sponsors.

Complete the Microsoft Graph (Security) Integration
- Login to the SamurAI Portal
- Click Telemetry and select Integrations from the main menu
- Select Create
- Locate and click Microsoft Graph (Security)
- Click Next (we leverage a Samurai Cloud Collector)
- Enter Tenant ID, Application ID and Client Secret as created in Application Registration
- Click Finish
Our Integration guide was accurate at the time of writing but vendors change things frequently! If you find errors or anything is outdated, let us know by raising a request in the SamurAI MDR Portal and we shall get it updated.
8.51 - Microsoft IIS
| SamurAI [Local] Collector | SamurAI [Cloud] Collector |
|---|
| |
Use this document to install and configure the Filebeat agent to send Microsoft Internet Information Services (IIS) logs to Samurai using the Samurai Local Collector deployed in your network.
To complete this Integration you will need to:
- Ensure correct network connectivity
- Download & Install Filebeat
- Configure & Enable Microsoft IIS Logging
- Configure & Start Filebeat
This guide is based on the premise of a single Samurai Local Collector installation with deployment of a single Windows host with Microsoft IIS service(s) enabled and configured.
Ensure correct network connectivity
You must ensure the following connectivity requirements are fulfilled:
| Source | Destination | Ports | Description |
|---|
| Microsoft IIS Host | Samurai Local Collector | TCP/5044 | For log transmission |
Download & Install Filebeat
Perform the steps outlined in Step 1: Install Filebeat as per the vendor documentation.
Make sure to click the Windows tab for OS selection.
Follow the steps outlined below as per the vendor documentation for either per-site or per-server configuration that is best suited to your setup.
- Configure Logging at the Site Level.
- Configure Per-site Logging at the Server Level.
During step 4 in the vendor documentation, select W3C logging format.

Under “Select Fields…”, select all available fields:

Configure a suitable log file path for the logging files according to your system requirements.
During step 6 in the vendor documentation, configure Log File Rolloversettings and **Maximum file size (in bytes)**according to your system needs and requirements.
Note down the file path that has been configured, this will be used later in the section Configure & Start Filebeat.
- Access the Filebeat installation folder and open and edit the file filebeat.yml.
- Modify the below template by replacing the section IP_OF_LOCAL_COLLECTOR with the IP address of the Samurai Local Collector.
- Modify the paths section of the template to use the path that was configured for the ISS Web Server log file location from Configure & Enable Microsoft IIS Logging.
# ============================== Filebeat inputs ===============================
filebeat.inputs:
  - type: filestream
    id: microsoft_iis
    enabled: true
    paths:
      - 'c:\inetpub\logs\LogFiles\*\*.log'
    include_lines: ['^[^#].*?$']
    tags: [microsoft_iis]

# ------------------------------ Logstash Output -------------------------------
output.logstash:
  hosts: ["IP_OF_LOCAL_COLLECTOR:5044"]
- Replace the default configuration of filebeat.yml with the modified template and save the file.
- Perform the steps outlined in Step 5: Start Filebeat as per the vendor documentation to start the service.
Make sure to click the Windows tab for OS selection.
Our Integration guide was accurate at the time of writing but vendors change things frequently! If you find errors or anything is outdated, let us know by raising a request in the SamurAI MDR Portal and we shall get it updated.
8.52 - Microsoft Windows Event Log
| SamurAI [Local] Collector | SamurAI [Cloud] Collector |
|---|
| |
Use this document to install and configure the Winlogbeat agent to send Microsoft Windows Event Logs to Samurai using the Samurai Local Collector deployed in your network.
To complete this Integration you will need to:
- Ensure correct network connectivity
- Download & install Winlogbeat
- Configure & Start Winlogbeat
This guide is based on the premise of a single Samurai Local Collector installation with deployment of a single Windows host. Repeat these steps outlined in this guide for each Windows host and site.
Ensure correct network connectivity
You must ensure the following connectivity requirements are fulfilled:
| Source | Destination | Ports | Description |
|---|
| Windows Host | Samurai Local Collector | TCP/5044 | For log transmission |
Download & Install Winlogbeat
Perform the steps outlined in Step 1: Install Winlogbeat as per the vendor documentation.
- Access the Winlogbeat installation folder and open and edit the file winlogbeat.yml.
- Modify the below template by replacing the section IP_OF_LOCAL_COLLECTOR with the IP address of the Samurai Local Collector.
# ======================== Winlogbeat specific options =========================
winlogbeat.event_logs:
  - name: Application
  - name: System
  - name: Security
  - name: Microsoft-Windows-Sysmon/Operational
# ------------------------------ Logstash Output -------------------------------
output.logstash:
  hosts: ["IP_OF_LOCAL_COLLECTOR:5044"]
Default recommendation is to ingest logs from Application, System, Security and Sysmon (if used and installed). Optionally, if you want to ingest other event logs, follow the
vendor guidelines to find the correct event log names to use and modify the template accordingly.
- Replace the default configuration of winlogbeat.yml with the modified template and save the file.
- Perform the steps outlined in Step 5: Start Winlogbeat as per the vendor documentation to start the service.
The section about authorized to publish events can be ignored.
Our Integration guide was accurate at the time of writing but vendors change things frequently! If you find errors or anything is outdated, let us know by raising a request in the SamurAI MDR Portal and we shall get it updated.
8.53 - Nozomi Networks Guardian
| SamurAI [Local] Collector | SamurAI [Cloud] Collector |
|---|
| |
Connectivity Requirements
You must ensure the following connectivity requirements are available:
| Source | Destination | Ports | Description |
|---|
| Guardian | Samurai Local Collector | TCP/514 (Syslog) | For log transmission |
| Samurai Local Collector | Guardian | TCP/443 (Default HTTPS) | Alerts and related evidence |
Ensure that the Syslog Capture Feature is enabled:
Follow the steps outlined within the Nozomi documentation to send logs to your Samurai Local Collector. We reference the CMC documentation:
Use the following parameters when completing the steps:
- Configuration: Syslog Forwarder
- To URI: TCP://LOCALCOLLECTOR:514
Replace LOCALCOLLECTOR with the IP address of your Samurai Local Collector
Extended Telemetry Collection Prerequisites
Perform the following steps to allow Extended Telemetry Collection.
Follow the steps outlined within the Nozomi Networks documentation:
Use the following parameters when completing the steps:
- Allowed sections: Enable Queries and Exports
Follow the steps outlined within the Nozomi Networks documentation:
Use the following parameters when completing the steps:
- Source: Local
- Group: Select the group created under Configure User Group
- Must update password: Uncheck
You will need the Username and Password that was setup during this step to complete the next section.
Complete the Nozomi Guardian Integration
- Login to the SamurAI Portal
- Click Telemetry and select Integrations from the main menu
- Click Create
- Find and select Nozomi Guardian
- Select the relevant Local Collector and click Next
- You will be presented with the Local Collector IP Address on the left of the screen
- To configure Extended Telemetry Collection ensure it is enabled via the toggle
- Enter the following information
- Name for the Integration - The name will appear in the SamurAI Portal for you to easily reference
- Description - Optional but if completed will appear in the SamurAI Portal for you to easily reference
- Username - Enter the username created in Configure User
- Password - Enter the password created in Configure User
- Hostname / IP - Enter the Hostname or IP address of the Guardian
- Custom port - Optional if you have changed the port for access
- Click on Finish
Our Integration guide was accurate at the time of writing but vendors change things frequently! If you find errors or anything is outdated, let us know by raising a request in the SamurAI MDR Portal and we shall get it updated.
8.54 - Okta Workforce Identity Cloud
| SamurAI [Local] Collector | SamurAI [Cloud] Collector |
|---|
| |
Pre-requisites
- An Okta account with administrative privileges
- Your Okta Instance
From the Okta admin console
Create an OAuth service app integration
Follow the Okta documentation to:
Make note of the ClientID under Client Credentials as you will need this when completing the integration in the SamurAI Portal.
Generate a public/private key pair
Follow the Okta documentation to:
Use the following settings when completing:
- Client Authentication - Public / Private Key
- Public Key Configuration - Save Keys in Okta
- Select PEM to ensure the private keys appear in PEM format
Ensure to take note of the Private Key (copy to clipboard) as you will need this when completing the integration in the SamurAI Portal
Grant allowed scopes
Follow the Okta documentation to:
Grant the following scope:
Assign read-only administrator
Follow the Okta documentation to:
Complete the Okta Workforce Identity Cloud Integration
- Login to the SamurAI Portal
- Click Telemetry and select Integrations from the main menu
- Select Create
- Locate and click Okta Workforce Identity Cloud
- Enter a Name of Integration
- Enter a Description (Optional)
- Enter your ClientID created under Create an OAuth 2.0 service app integration
- Enter your Instance this refers to your Okta domain
- Enter your PEM data by pasting your Private Key in PEM format created under Generate a public/private key pair
- Click Finish
Our Integration guide was accurate at the time of writing but vendors change things frequently! If you find errors or anything is outdated, let us know by raising a request in the SamurAI MDR Portal and we shall get it updated.
8.55 - Palo Alto Networks Cortex XDR Pro
| SamurAI [Local] Collector | SamurAI [Cloud] Collector |
|---|
| |
To complete this Integration you will need to:
1) From your Cortex XDR Gateway:
2) From the SamurAI Portal:
Follow Steps 1-3 outlined within the Palo Alto Networks documentation:
Use the following parameters when completing the steps:
| Field Name | Parameter |
|---|
| Security Level | Standard |
| Enable Expiration Date | not required (do not select) |
| Roles | Viewer |
Be sure to save a copy of the following information as it required to complete the integration:
- API key (as noted in the documentation you will not be able to view it again!)
- API KeyID
- FQDN (for the Base URL e.g https://api-{fqdn}
Complete the Palo Alto Cortex XDR Pro Integration
- Login to the SamurAI Portal
- Click Telemetry and select Integrations from the main menu
- Select Create
- Locate and click Palo Alto Networks Cortex XDR Pro
- Click Next (we leverage a Samurai Cloud Collector)
- Enter a Name of Integration
- Enter a Description (Optional)
- Enter your Device Name
- Enter the URL, API KeyID and API Key created in Configure an API Key to allow us to collect telemetry
- Click Finish
Our Integration guide was accurate at the time of writing but vendors change things frequently! If you find errors or anything is outdated, let us know by raising a request in the SamurAI MDR Portal and we shall get it updated.
8.56 - Palo Alto Networks Next-Generation Firewall
| SamurAI [Local] Collector | SamurAI [Cloud] Collector |
|---|
| |
To complete this Integration you will need to:
1) Ensure Connectivity Requirements are in place
2) From your Palo Alto Networks Next Generation Firewall:
4) From the SamurAI Portal:
Connectivity Requirements
You must ensure the following connectivity requirements are available:
| Source | Destination | Ports | Description |
|---|
| PAN NGFW | Samurai Local Collector | UDP/514 (syslog) | For log transmission |
| Samurai Local Collector | PAN NGFW | TCP/443 (https) | Packet captures |
| Samurai Local Collector | *.wildfire.paloaltonetworks.com(WildFire Public Cloud) | TCP/443 (https) | For WildFire reports (if applicable) |
Follow the steps outlined within the Palo Alto Networks documentation to configure your firewall to send logs to your Samurai Local Collector:
If you do not have Panorama deployed:
If you have Panorama deployed please refer to Palo Alto Networks: Panorama (Be aware of steps based on your Panorama deployment mode)
Use the following parameters when completing the steps:
| Field Name | Parameter |
|---|
| Server Profile Name | Whatever you want, however we suggest NTT_Syslog_Profile |
| Syslog Server | IP address of your Samurai Collector |
| Transport | UDP |
| Port | 514 (Default) |
| Format | BSD (Default) |
| Facility | keep as default |
| Custom Log Format | keep as default for every log type |
Create Log Forwarding Profiles
Follow the steps outlined within the Palo Alto Networks documentation:
You will need to configure Log forwarding profiles for each log type as per the table below:
| Field Name | Parameter |
|---|
| Name | Whatever you want, however we suggest NTT_Log_Fwd_Profile |
| Name for each Log Type | Whatever you want, however we suggest NTT_<log type>_Fwd_Profile. Where <log type> denotes each log type available |
| Log Type | All (you need to include all log types eg. traffic, threat, wildfire etc) |
| Filter | All logs |
| Forward Method | Select the syslog Server Profile you configured in Configure syslog to Samurai Local Collector (we suggested *NTT_Syslog_Profile) |
Create URL Filtering Profile
Follow the steps outlined within the Palo Alto Networks documentation:
Alternatively, modify your existing URL filtering profile(s). If reusing existing profile(s), ensure that no URL categories are set to the action allow unless you do not want them logged.
| Field Name | Parameter |
|---|
| Name | Whatever you want, however we suggest NTT_URL_Profile |
| Site Access for Each Category | Alert. If your company policy requires Block for certain categories, set it that way. |
| User Credential Submission for Each Category | Alert. If your company policy requires Block for certain categories, set it that way. |
| Settings | Ensure Log container page only is not selected |
| HTTP Header Logging | Enable: User-Agent, Referer, X-Forwarded-For |
Create Filtering Profile Group
Follow the steps outlined within the Palo Alto Networks documentation:
Use the following parameters when completing the steps:
Create Security Policy Rule
Follow the steps outlined within the Palo Alto Networks documentation:
Use the following parameters in the Actions tab when completing the steps:
| Field Name | Parameter |
|---|
| Profile Setting | Select the Group Profile you provided in Create Filtering Profile Group (we suggested NTT_Security_Profile) |
| Log at Session Start | Enabled |
| Log at Session End | Enabled |
| Log Forwarding | Select the Log Forwarding Profile you provided in Create Log Forwarding Profile (we suggested NTT_Log_Fwd_Profile) |
Enable Packet Capture Profiles
Follow the steps outlined within the Palo Alto Networks documentation:
You will need to enable Packet Capture for for each profile as tables below:
Anti Virus Profile
| Field Name | Parameter |
|---|
| Name | Whatever you want, however we suggest NTT_AV_Profile |
| Anti-Virus | Enable Packet-Capture |
Anti-Spyware Profile
| Field Name | Parameter |
|---|
| Name | Whatever you want, however we suggest NTT_Spyware_Profile |
Severity Critical
Severity High
Severity Medium | Select extended-capture |
Vulnerability Protection Profile
| Field Name | Parameter |
|---|
| Name | Whatever you want, however we suggest NTT_IDS_Profile |
Severity Critical
Severity High
Severity Medium | Select extended-capture |
Enable API Access
Follow the steps outlined within the Palo Alto Networks documentation:
Creating a new Admin Role Profile to be used specifically by the Samurai platform.
Under XML API ensure to disable all permissions except the following:
- Log
- Operation Requests
- Export
Once complete you now need to get the API key to be used in the SamurAI Portal. Follow the Palo Alto documentation:
When following the steps be sure to use the username and password you created in the previous step. Once successful make a note of the <Key> string as you will need this later when you Complete the Palo Alto Networks NG Firewall Integration
Obtain your Wildfire API Key
If you leverage Wildfire, follow the steps outlined in the Palo Alto documentation to obtain your Wildfire API key:
Ensure to select your deployment model when obtaining your API key.
Complete the Palo Alto Networks Next-Generation Firewall Integration
- Login to the SamurAI Portal
- Click Telemetry and select Integrations from the main menu
- Click Create
- Find and select Palo Alto Networks Next-Generation Firewall
- Select the relevant Local Collector and click Next
- You will be presented with the Local Collector IP Address on the left of the screen
- To configure Extended Data Collection ensure it is enabled via the toggle
- Enter the following information
- Name for the Integration - the name will appear in the SamurAI Portal for you to easily reference
- Description - optional but if completed will appear in the SamurAI Portal for you to easily reference)
- API-Key - you captured in Enable API Access
- Wildfire API-Key (optional) - to enable Wildfire telemetry collection include the key you captured in Obtain your Wildfire API key
- Hostname/IP - hostname or IP address of Palo Alto device to collect alerts from
- Vsys (optional) - if you leverage virtual systems add the vsys names e.g vsys1, vsys2. If you do not add vsys the default vsys1 is used
- Threat severity ignore list (optional) - to optionally ignore specific severity threats, specify from the drop down list. By default we ignore informational and low severity threats to reduce noise.
- Click on Finish
Our Integration guide was accurate at the time of writing but vendors change things frequently! If you find errors or anything is outdated, let us know by raising a request in the SamurAI MDR Portal and we shall get it updated.
8.57 - Palo Alto Networks Panorama
| SamurAI [Local] Collector | SamurAI [Cloud] Collector |
|---|
| |
To complete this Integration you will need to:
1) Ensure Connectivity Requirements are in place
2) From your Palo Alto Networks Panorama:
4) From the SamurAI Portal:
Connectivity Requirements
You must ensure the following connectivity requirements are available:
| Source | Destination | Ports | Description |
|---|
| Panorama | Samurai Local Collector | UDP/514 (syslog) | For log transmission |
| Samurai Local Collector | Panorama | TCP/443 (https) | For Packet Captures |
Follow the steps outlined within the Palo Alto Networks documentation to configure your Panorama to send logs to your Samurai Local Collector:
Ensure to select your current version, we have linked version 11.1 and later.
Use the following parameters when completing the steps:
| Documentation Step | Field Name | Parameter |
|---|
| 4.2 | Server Profile Name | Whatever you want, however we suggest NTT_Syslog_Profile |
| 4.2 | Syslog Server | IP address of your Samurai Collector |
| 4.2 | Transport | UDP |
| 4.2 | Port | 514 (Default) |
| 4.2 | Format | BSD (Default) |
| 4.2 | Facility | keep as default |
| 4.4 | Custom Log Format | keep as default for every log type |
If you will not be using the Panorama Management interface you will need to configure an alternative ethernet interface to forward syslog by following the documentation from Step 5.
You must have your Palo Alto Next Generation Firewalls configured to forward logs to Panorama - if you have not configured this yet then follow the steps outlined in [Configure Log Forwarding to Panorama]https://docs.paloaltonetworks.com/panorama/11-1/panorama-admin/manage-log-collection/configure-log-forwarding-to-panorama)
Enable API Access
Follow the steps outlined within the Palo Alto Networks documentation:
Creating a new Admin Role Profile to be used specifically by Samurai.
Under XML API ensure to disable all permissions except the following:
- Log
- Operation Requests
- Export
Once complete you now need to get the API key to be used in the SamurAI Portal. Follow the Palo Alto documentation:
When following the steps be sure to use the username and password you created in the previous step. Once successful make a note of the <Key> string as you will need this later when you Complete the Palo Alto Networks Panorama Integration
Obtain your Wildfire API key
If you leverage Wildfire, follow the steps outlined in the Palo Alto documentation to obtain your Wildfire API key:
Ensure to select your deployment model when obtaining your API key.
Complete the Palo Alto Networks Panorama Integration
Login to the SamurAI Portal
Click Telemetry and select Integrations from the main menu
Click Create
Find and select Palo Alto Networks Next-Generation Firewall Panorama
Select the relevant Local Collector and click Next
You will be presented with the Local Collector IP Address on the left of the screen
To configure Extended Telemetry Collection ensure it is enabled via the toggle
Enter the following information
- Name for the Integration - the name will appear in the application for you to easily reference
- Description - optional but if completed will appear in the application for you to easily reference)
- Manager name- this name is used as the source for alerts for this integration
- API-Key you captured in Enable API Access
- Wildfire API-key - to enable Wildfire telemetry collection include the key you captured in Obtain your Wildfire API key
- Hostname/IP - hostname or IP address of Palo Alto device to collect alerts from
Click on Finish
Our Integration guide was accurate at the time of writing but vendors change things frequently! If you find errors or anything is outdated, let us know by raising a request in the SamurAI MDR Portal and we shall get it updated.
8.58 - PowerDNS Recursor
| SamurAI [Local] Collector | SamurAI [Cloud] Collector |
|---|
| |
This guide describes the steps required to configure PowerDNS Recursor logs to a Samurai Local Collector deployed on your network by configuring rsyslog.
Connectivity Requirements
You must ensure the following connectivity requirements are available:
| Source | Destination | Ports | Description |
|---|
| PowerDNS Host | Samurai Local Collector | TCP/514 (syslog) | For log transmission |
Table 1: Connectivity requirements
Ensure that Structured Logging is enabled and Quiet is disabled in the PowerDNS Recursor configuration file, normally located at /etc/powerdns/recursor.conf:
structured-logging=yes
quiet=no
Follow the below steps to configure rsyslog to forward authentication events.
Rsyslog prerequisites
Ensure the following statement is included in the main rsyslog configuration file, normally located at /etc/rsyslog.conf:
$IncludeConfig /etc/rsyslog.d/*.conf
If no IncludeConfig statement exist for the /etc/rsyslog.d/ directory, append it to the end of rsyslog.conf.
Create /etc/rsyslog.d/ntt_powerdns.conf
Create /etc/rsyslog.d/ntt_powerdns.conf and insert the below configuration block, enter the Local Collector IP in the Target field.
template(
	name = "powerdns-recursor"
	type = "string"
	string = "<%PRI%>1 %TIMESTAMP:::date-rfc3339% %HOSTNAME% %APP-NAME% %PROCID% powerdns_recursor %STRUCTURED-DATA% %msg%"
)
if ($programname == "pdns-recursor") then {
	action(
		queue.type="LinkedList"
		queue.size="10000"
		type="omfwd"
		template="powerdns-recursor"
		Target="<Local Collector IP>"
		Port="514"
		Protocol="tcp"
	)
}
Validate and restart service
Confirm that rsyslog can parse the configuration without any errors by running:
rsyslogd -N1
Then restart the rsyslog service:
sudo systemctl restart rsyslog
The log messages will now be forwarded to the Samurai Local Collector.
For integrations that utilize a Local Collector where we ingest syslog only, you do not need to follow specific steps in the SamurAI MDR portal as we auto detect the vendor and product. The only reason you need to use the SamurAI MDR portal is if you need to determine the Local Collector IP address. Of course you will still need to ensure the integration is functioning! See Integrations for more information on checking status.
Our Integration guide was accurate at the time of writing but vendors change things frequently! If you find errors or anything is outdated, let us know by raising a request in the SamurAI MDR Portal and we shall get it updated.
8.59 - Proofpoint Targeted Attack Protection (TAP)
| SamurAI [Local] Collector | SamurAI [Cloud] Collector |
|---|
| |
The guide outlined the steps required to configure Proofpoint Targeted Attack Protection (TAP) to facilitate log ingestion into the Samurai platform.
To complete this Integration you will need to:
2) From your TAP dashboard:
3) From the SamurAI Portal:
Generate TAP Service Credentials
Ensure you copy the Service Principle and Secret as you will need this information to complete the integration.
Complete the Proofpoint Targeted Attack Protection (TAP)
Login to your Samurai tenant
Click Telemetry and select Integrations from the main menu
Select Create
Locate and click Proofpoint Targeted Attack Protection
Click Next (we leverage a Samurai Cloud Collector)
Enter a Name of Integration
Enter a Description (Optional)
8. Enter a Devicename
Enter your Service Principle
Enter your Secret
Click Finish
Our Integration guide was accurate at the time of writing but vendors change things frequently! If you find errors or anything is outdated, let us know by raising a request in the SamurAI MDR Portal and we shall get it updated.
8.60 - Samba AD
| SamurAI [Local] Collector | SamurAI [Cloud] Collector |
|---|
| |
This guide describes the steps required to configure Samba Active Directory (AD) to send authentication logs to a Samurai Local Collector deployed on your network by configuring rsyslog.
Connectivity Requirements
You must ensure the following connectivity requirements are available:
| Source | Destination | Ports | Description |
|---|
| Samba AD host | Samurai Local Collector | TCP/514 (syslog) | For log transmission |
Table 1: Connectivity requirements
Ensure that Authentication Audit Logging in JSON format is configured in the smb.conf file.
[global]
log level = 1 auth_json_audit:3
Follow the below steps to configure rsyslog to forward authentication events.
Rsyslog prerequisites
Ensure the following statement is included in the main rsyslog configuration file, normally located at /etc/rsyslog.conf:
$IncludeConfig /etc/rsyslog.d/*.conf
If no IncludeConfig statement exist for the /etc/rsyslog.d/ directory, append it to the end of rsyslog.conf.
Create /etc/rsyslog.d/ntt_smb_auth.conf
Create /etc/rsyslog.d/ntt_smb_auth.conf and insert the below configuration block, enter the Local Collector IP in the Target field.
template(
  name = "samba-auth"
  type = "string"
  string = "<%PRI%>1 %TIMESTAMP:::date-rfc3339% %HOSTNAME% %APP-NAME% %PROCID% samba_auth %STRUCTURED-DATA% %msg%"
)

if ($programname == "samba_auth") then {
  action(
    queue.type="LinkedList"
    queue.size="10000"
    type="omfwd"
    template="samba-auth"
    Target="<Local Collector IP>"
    Port="514"
    Protocol="tcp")
}
Validate and restart service
Confirm that rsyslog can parse the configuration without any errors by running:
rsyslogd -N1
Then restart the rsyslog service:
sudo systemctl restart rsyslog
For integrations that utilize a Local Collector where we ingest syslog only, you do not need to follow specific steps in the SamurAI MDR portal as we auto detect the vendor and product. The only reason you need to use the SamurAI MDR portal is if you need to determine the Local Collector IP address. Of course you will still need to ensure the integration is functioning! See Integrations for more information on checking status.
Our Integration guide was accurate at the time of writing but vendors change things frequently! If you find errors or anything is outdated, let us know by raising a request in the SamurAI MDR Portal and we shall get it updated.
8.61 - Sophos Central
| SamurAI [Local] Collector | SamurAI [Cloud] Collector |
|---|
| |
Sophos Central telemetry is collected via REST API.
Supported Products
Sophos Central can integrate with many Sophos and Third-Party products. The following products are supported through the Sophos Central integration:
To complete this Integration you will need to:
1) Within Sophos Central Admin
2) From the SamurAI Portal:
Create an API Token
Follow steps outlined within the Sophos documentation:
Be sure to save a copy of the following information as it required to complete the integration:
- Client ID
- Client Secret (as noted in the documentation you will not be able to view it again!)
Complete the Sophos Central Integration
You will need:
- Login to the SamurAI Portal
- Click Telemetry and select Integrations from the main menu
- Select Create
- Locate and click Sophos Central
- Click Next (we leverage a Samurai Cloud Collector)
- Enter a Name of Integration
- Enter a Description (Optional)
- Enter your Devicename
- Enter your Client ID
- Enter your Client Secret
- Enter your Tenant ID (optional) - if not included we will identify from your credentials
- Click Finish
Our Integration guide was accurate at the time of writing but vendors change things frequently! If you find errors or anything is outdated, let us know by raising a request in the SamurAI MDR Portal and we shall get it updated.
8.62 - Squid Cache
| SamurAI [Local] Collector | SamurAI [Cloud] Collector |
|---|
| |
This guide describes the steps required to configure Squid Cache hosts to send logs to a Samurai Local Collector deployed on your network by configuring rsyslog.
Connectivity Requirements
You must ensure the following connectivity requirements are available:
| Source | Destination | Ports | Description |
|---|
| Squid Cache | Samurai Local Collector | TCP/514 (syslog) | For log transmission |
Table 1: Connectivity requirements
Ensure that access_log is configured to log in format combined to syslog in the squid.conf file.
access_log syslog:local0.info combined
Follow the below steps to configure rsyslog to forward authentication events.
Rsyslog prerequisites
Ensure the following statement is included in the main rsyslog configuration file, normally located at /etc/rsyslog.conf:
$IncludeConfig /etc/rsyslog.d/*.conf
If no IncludeConfig statement exist for the /etc/rsyslog.d/ directory, append it to the end of rsyslog.conf.
Create /etc/rsyslog.d/ntt_squid.conf
Create /etc/rsyslog.d/ntt_squid.conf and insert the below configuration block, enter the Local Collector IP in the Target field.
template(
  name = "squid-access"
  type = "string"
  string = "<%PRI%>1 %TIMESTAMP:::date-rfc3339% %HOSTNAME% %APP-NAME% %PROCID% squid_access %STRUCTURED-DATA% %msg%"
)

if ($programname == "squid") then {
  action(
    queue.type="LinkedList"
    queue.size="10000"
    type="omfwd"
    template="squid-access"
    Target="<Local Collector IP>"
    Port="514"
    Protocol="tcp")
}
Validate and restart service
Confirm that rsyslog can parse the configuration without any errors by running:
rsyslogd -N1
Then restart the rsyslog service:
sudo systemctl restart rsyslog
The authentication messages will now be forwarded to the Samurai Local Collector.
For integrations that utilize a Local Collector where we ingest syslog only, you do not need to follow specific steps in the SamurAI MDR portal as we auto detect the vendor and product. The only reason you need to use the SamurAI MDR portal is if you need to determine the Local Collector IP address. Of course you will still need to ensure the integration is functioning! See Integrations for more information on checking status.
Our Integration guide was accurate at the time of writing but vendors change things frequently! If you find errors or anything is outdated, let us know by raising a request in the SamurAI MDR Portal and we shall get it updated.
8.63 - Trellix Endpoint Security (ENS)
| SamurAI [Local] Collector | SamurAI [Cloud] Collector |
|---|
| |
This guide describes the steps required to configure Trellix Endpoint Security (ENS) to send logs through a Trellix ePolicy Orchestrator (On-prem) to a Samurai Local Collector deployed in your network.
Connectivity Requirements
You must ensure the following connectivity requirements are available:
| Source | Destination | Ports | Description |
|---|
| Trellix ePolicy Orchestrator | Samurai Local Collector | TCP/6514 (syslog) | For log transmission |
Table 1: Connectivity requirements
Syslog Configuration
Follow the Trellix Register syslog servers documentation using the following parameters:
| Parameter | Value |
|---|
| Server name | IP of the Samurai Local Collector |
| TCP port number | 6514 |
For integrations that utilize a Local Collector where we ingest syslog only, you do not need to follow specific steps in the SamurAI MDR portal as we auto detect the vendor and product. The only reason you need to use the SamurAI MDR portal is if you need to determine the Local Collector IP address. Of course you will still need to ensure the integration is functioning! See Integrations for more information on checking status.
Our Integration guide was accurate at the time of writing but vendors change things frequently! If you find errors or anything is outdated, let us know by raising a request in the SamurAI MDR Portal and we shall get it updated.
8.64 - Trellix Endpoint Security (HX)
| SamurAI [Local] Collector | SamurAI [Cloud] Collector |
|---|
| |
To complete this Integration you will need to:
1) Ensure Connectivity Requirements are in place
2) From the Trellix HX Console:
For additional information on any of the steps that must be followed in the Trellix Endpoint Security UI please consult official Trellix documentation which requires Trellix ServicePortal credentials.
3) From the SamurAI Portal:
Connectivity Requirements
| Source | Destination | Port | Description |
|---|
| SamurAI Local Collector | Trellix Endpoint Security Server | TCP/443 | API access |
| Trellix Endpoint Security Server | SamurAI Local Collector | UDP/514
or
TCP/514 | Log forwarding |
Create Users
Perform the following steps:
- Login to the Endpoint Security Web UI with admin access
- Navigate to Admin > Appliance Settings
- Click User Accounts and specify the following information to create a new user account for NTT:
| Account | Parameter |
|---|
| User Name | you choose however we recommend: api_analyst_ntt |
| Role | api_admin |
| Password | [Set secure password] |
NTT recommends that you set a password of minimum eight-character length, with random characters including digits and symbols, and that you set a different password for each account.
Verify the logins using the above accounts as you will need this information to Complete the Trellix Endpoint Security (HX) Integration
Acquisition Setting
Configure the Acquisition setting to enable triage file retrieval:
- Login to the Endpoint Security Web UI with admin access
- Navigate to Admin > Policies
- In the Edit Policy page under Configurations, click Audits - version number
- Turn on Enable the File and Data Audits on the host.
- Click Save.
Enable Auto Triage
Configure the auto triage setting to make triage files available in the HX instance:
- Login to the Endpoint Security Web UI with admin access
- Navigate to Admin > Triage Settings
- On the Automatic Triages settings page, toggle the Triage Settings switch to ON
- Click Save.
Data Acquisition Script Setting
Configure the Data Acquisition setting to enable event log retrieval:
- Login to the Endpoint Security Web UI with admin access
- Navigate to Admin > Data Acquisition Scripts
- Click Standard Investigative Details.
- On the Script Description page, click ACTIONS and select Edit
- Click Event Logs and then enable Security logs in the Windows event logs section.
- Click Save.
Configuration for Log Collection
Configure a syslog server (the SamurAI Local Collector) using the CLI.
There is no remote syslog configuration by default.
# show logging
  Local logging level: notice
	Override for class cef: none
  Remote syslog default level: notice.
- Go to CLI Configuration mode and enter the following commands to configure syslog:
hostname > enable
hostname # configure terminal
hostname (config) # logging [IP Address of your Local Collector] trap none
hostname (config) # logging [IP Address of your Local Collector] trap overrride class cef
priority info
hostname # logging [IP Address of your Local Collector] protocol tcp
hostname (config) # (config) # write memory
- Configure RFC-3339 Time Format
hostname > enable
hostname # configure terminal
hostname (config) # logging fields timestamp format rfc-3339
hostname (config) # (config) # write memory
Polling Configuration
This configuration is not mandatory but recommended to configure certain parameters in order to fully align with our service.
Perform the following steps:
- Login to the Endpoint Security Web UI with admin access
- Navigate to Admin > Policies
- From the Policies page, click Agent Default policy to edit the policy
- From the Edit Policy page, select Polling and overwrite the parameters highlighted in the table below
| Parameters | Time |
|---|
| ① Polling agents | 1 minute |
| ② Fastpoll agents | 30 seconds |
| ③ Request sysinfo | 10 minutes |
| ④ Poll for agent config | 15 minutes |
- Click Save to apply the configuration
Complete the Trellix Endpoint Security (HX) Integration
Login to the SamurAI Portal
Click Telemetry and select Integrations from the main menu
Click Create
Find and select Trellix Endpoint Security (HX)
Select the intended SamurAI Local Collector
You will be presented with the Local Collector IP Address on the left of the screen
To configure Extended Telemetry Collection ensure it is enabled via the toggle
Enter the following information:
- Name for the Integration - the name will appear in the SamurAI Portal for you to easily reference
- Description (optional) - if completed will appear in the SamurAI Portal for you to easily reference)
- Devicename - an arbitrary name to identify FireEye HX
- Username - enter a username (created under Create Users)
- Password - specify password to use (created under Create Users)
- Hostname / IP - IP address or hostname of the manager
- Custom Port (optional)- if you have changed the default port enter the port number, if not, we default to 443
Click on Finish
Our Integration guide was accurate at the time of writing but vendors change things frequently! If you find errors or anything is outdated, let us know by raising a request in the SamurAI MDR Portal and we shall get it updated.
8.65 - Trend Micro Vision One
| SamurAI [Local] Collector | SamurAI [Cloud] Collector |
|---|
| |
To complete this Integration you will need to:
1) From the Trend Micro Vision One console
2) From the SamurAI Portal
Create an API Key
Follow the steps outlined in the Trend Micro documentation:
When completing the steps be sure to:
Determine your Trend Vision One region
Review the Trend Micro documentation to determine your region:
Complete the Trend Micro Vision One Integration
You will need:
- Login to the SamurAI Portal
- Click Telemetry and select Integrations from the main menu
- Click Create
- Click Next (we leverage a Samurai Cloud Collector)
- Find and select Trend Micro Vision One
- Enter the Authentication Token within the Access token field
- Select the Regional Domain
- Click on Finish
Our Integration guide was accurate at the time of writing but vendors change things frequently! If you find errors or anything is outdated, let us know by raising a request in the SamurAI MDR Portal and we shall get it updated.
8.66 - Veeam Backup & Replication
| SamurAI [Local] Collector | SamurAI [Cloud] Collector |
|---|
| |
This guide describes the steps required to configure Veeam Backup & Replication to send syslog events to a Samurai Local Collector deployed in your network.
Connectivity Requirements
| Source | Destination | Ports | Description |
|---|
| Veeam Backup & Replication | Samurai Local Collector | TCP/514 | For log transmission |
Veeam Configuration
Follow the vendor documentation to add a new syslog server:
Please ensure TCP is selected under Step 4 for best reliability.
Above default guide references the vSphere vendor documentation page. In case you utilize another system, please reference the most suitable
Product Guides.
For integrations that utilize a Local Collector where we ingest syslog only, you do not need to follow specific steps in the SamurAI MDR portal as we auto detect the vendor and product. The only reason you need to use the SamurAI MDR portal is if you need to determine the Local Collector IP address. Of course you will still need to ensure the integration is functioning! See Integrations for more information on checking status.
Our Integration guide was accurate at the time of writing but vendors change things frequently! If you find errors or anything is outdated, let us know by raising a request in the SamurAI MDR Portal and we shall get it updated.
8.67 - VMware Carbon Black Cloud Enterprise EDR
| SamurAI [Local] Collector | SamurAI [Cloud] Collector |
|---|
| |
VMWare Carbon Black Cloud Enterprise EDR logs and data are collected via REST API and Streaming API.
To complete this Integration you will need to:
1) Within the VMware Carbon Black Cloud web interface
2) From the SamurAI Portal:
Determine Environment
The URL for API access appears in the address bar in a browser as follows:
https://defense-<Cloud Instance ID>.conferdeploy.net
Take note of this URL as it will be required when completing the Integration within the SamurAI Portal.
Determine Org Key for API Access
To determine your Org Key for API Access:
- Login to your Carbon Black Cloud instance
- Select Settings > API Access
- The ORG KEY is shown on the screen.
Take note of this Org Key as it will be required when completing the Integration within the SamurAI Portal.
API Access
Use these steps to configure a custom API access level:
- Log in to your Carbon Black Cloud Instance with an account that has the Super Admin role.
- Click Settings > API Access
- Go to the Access Level-tab
- Click Add Access Level
- In the Name field, enter Samurai-Access
- Enter a description
- Select the following permissions
- org.alerts Read
- org.watchlists Read
- device Read
- org.search.events Create, Read
- Click Save
Use these steps to enable API configuration to allow Samurai to gather telemetry:
Click Settings > API Access
Click +Add API Key
Add a new API key with the following information:
- In the Name field, enter Samurai-MDR
- From the Access Level type list, select Custom
- From Custom Access Level list, select Samurai-Access
- Click Save
The API credentials are displayed
Use the copy button to copy the Samurai-MDR API ID and API Secret Key. Paste the information to a file clearly indicating name, API ID, and API secret key.
If you did not manage to copy the information, click the down arrow on the corresponding Samurai-MDR row and select API Credentials
You will need the API ID and API Secret key when completing the integration within the SamurAI Portal.
Complete the VMware Carbon Black Cloud Enterprise EDR Integration
You will need:
- Login to the SamurAI Portal
- Click Telemetry and select Integrations from the main menu
- Select Create
- Locate and click Carbon Black Enterprise EDR
- Click Next (we leverage a Samurai Cloud Collector)
- Enter a Name of Integration
- Enter a Description (Optional)
- Enter your Environment
- Enter your Organization Key
- Enter your API ID
- Enter your API Secret
- Click Finish
Our Integration guide was accurate at the time of writing but vendors change things frequently! If you find errors or anything is outdated, let us know by raising a request in the SamurAI MDR Portal and we shall get it updated.
8.68 - WatchGuard Firebox
| SamurAI [Local] Collector | SamurAI [Cloud] Collector |
|---|
| |
This guide describes the steps required to configure WatchGuard Firebox to send logs to a Samurai Local Collector deployed on your network. The Firebox requires access to the Local Collector via syslog on port 514/UDP.
1) From your WatchGuard Firebox:
Adding Syslog Servers
Follow the steps outlined in the following section of the WatchGuard documentation.
Use the following parameters when completing the steps:
| Field Name | Parameter |
|---|
| IP Address | IP address of your Samurai MDR Local Collector |
| Port | 514 |
| Log Format | IBM LEEF |
| Description | Whatever you want. |
| The serial number of the device | Enabled |
| The syslog header | Enabled |
| Syslog facility | Required log message types: Traffic, Alarm
Optional log message types: Event, Diagnostic, Performance |
Table 1: Adding Syslog Servers
For integrations that utilize a Local Collector where we ingest syslog only, you do not need to follow specific steps in the SamurAI MDR portal as we auto detect the vendor and product. The only reason you need to use the SamurAI MDR portal is if you need to determine the Local Collector IP address. Of course you will still need to ensure the integration is functioning! See Integrations for more information on checking status.
Our Integration guide was accurate at the time of writing but vendors change things frequently! If you find errors or anything is outdated, let us know by raising a request in the SamurAI MDR Portal and we shall get it updated.
8.69 - Zscaler Internet Access (ZIA)
| SamurAI [Local] Collector | SamurAI [Cloud] Collector |
|---|
| |
Connectivity Requirements
You must ensure the following connectivity requirements are fulfilled:
| Source | Destination | Ports | Description |
|---|
| Zscaler NSS Server | Samurai Local Collector | TCP/514 | For log transmission |
Adding NSS Server
Follow the steps outlined in the ZIA documentation. If you use an existing one, skip this section.
Use the following parameters when completing the steps:
| Field Name | Parameter |
|---|
| Name | Whatever you want, however we suggest: NTT Monitoring |
| Type | NSS for Web / NSS for Firewall |
There are two types of NSS servers, NSS for Web and NSS for Firewall.
Adding NSS Feeds for Web Logs
Follow the steps outlined in the ZIA documentation.
Use the following parameters when completing the steps:
| Field Name | Parameter |
|---|
| Feed Name | Whatever you want, however we suggest: NTT-Web |
| NSS Type | Select your NSS Server created in Adding NSS Server or the existing server |
| SIEM Destination Type | IP Address |
| SIEM IP Address | IP address of your Samurai Local Collector |
| Log Type | Web Log |
| Feed Output Type | Custom |
| Feed Output Format | \{ "sourcetype" : "zscalernss-web", "event" : \{"datetime":"%d{yy}-%02d{mth}-%02d{dd} %02d{hh}:%02d{mm}:%02d{ss}","reason":"%s{reason}","event_id":"%d{recordid}","protocol":"%s{proto}","action":"%s{action}","transactionsize":"%d{totalsize}","responsesize":"%d{respsize}","requestsize":"%d{reqsize}","urlcategory":"%s{urlcat}","serverip":"%s{sip}","clienttranstime":"%d{ctime}","requestmethod":"%s{reqmethod}","refererURL":"%s{ereferer}","useragent":"%s{eua}","product":"NSS","location":"%s{elocation}","ClientIP":"%s{cip}","status":"%s{respcode}","user":"%s{elogin}","url":"%s{eurl}","vendor":"Zscaler","hostname":"%s{ehost}","clientpublicIP":"%s{cintip}","threatcategory":"%s{malwarecat}","threatname":"%s{threatname}","filetype":"%s{filetype}","appname":"%s{appname}","pagerisk":"%d{riskscore}","department":"%s{edepartment}","urlsupercategory":"%s{urlsupercat}","appclass":"%s{appclass}","dlpengine":"%s{dlpeng}","urlclass":"%s{urlclass}","threatclass":"%s{malwareclass}","dlpdictionaries":"%s{dlpdict}","fileclass":"%s{fileclass}","bwthrottle":"%s{bwthrottle}","servertranstime":"%d{stime}","contenttype":"%s{contenttype}","unscannabletype":"%s{unscannabletype}","deviceowner":"%s{deviceowner}","devicehostname":"%s{devicehostname}","upload_filetype":"%s{upload_filetype}","upload_filename":"%s{upload_filename}"\}\} |
| Timezone | GMT |
| Duplicate Logs | Disabled |
Adding NSS Feeds for Firewall Logs
Follow the steps outlined in the ZIA documentation.
Use the following parameters when completing the steps:
| Field Name | Parameter |
|---|
| Feed Name | Whatever you want, however we suggest: NTT-FW |
| NSS Type | NSS for Firewall |
| NSS Server | Select your NSS Server created in Adding NSS Server or the existing server |
| SIEM Destination Type | IP Address |
| SIEM IP Address | IP address of your Samurai Local Collector |
| SIEM TCP Port | 514 |
| Log Type | Firewall Logs |
| Feed Output Type | JSON |
| Timezone | GMT |
| Duplicate Logs | Disabled |
Adding NSS Feeds for DNS Logs
Follow the steps outlined in the ZIA documentation.
Use the following parameters when completing the steps:
| Field Name | Parameter |
|---|
| Feed Name | Whatever you want, however we suggest: NTT-DNS |
| NSS Type | NSS for Firewall |
| NSS Server | Select your NSS Server created in Adding NSS Server or the existing server |
| SIEM Destination Type | IP Address |
| SIEM IP Address | IP address of your Samurai Local Collector |
| SIEM TCP Port | 514 |
| Log Type | DNS Logs |
| Feed Output Type | JSON |
| Timezone | GMT |
| Duplicate Logs | Disabled |
For integrations that utilize a Local Collector where we ingest syslog only, you do not need to follow specific steps in the SamurAI MDR portal as we auto detect the vendor and product. The only reason you need to use the SamurAI MDR portal is if you need to determine the Local Collector IP address. Of course you will still need to ensure the integration is functioning! See Integrations for more information on checking status.
Our Integration guide was accurate at the time of writing but vendors change things frequently! If you find errors or anything is outdated, let us know by raising a request in the SamurAI MDR Portal and we shall get it updated.
8.70 - Zscaler Private Access (ZPA)
| SamurAI [Local] Collector | SamurAI [Cloud] Collector |
|---|
| |
Connectivity Requirements
You must ensure the following connectivity requirements are fulfilled:
| Source | Destination | Ports | Description |
|---|
| Zscaler App Connector | Samurai Local Collector | TCP/514 | For log transmission |
You must leverage the Zscaler Log Streaming Service (LSS). LSS is deployed using two components: a log receiver (the Samurai local collector) and a ZPA Connector. For further information
you can refer to the
Zscaler documentation.
Log Receiver Configuration
Follow the steps outlined in the ZPA documentation.
Use the following parameters when completing the steps within the documentation under section 1. Log Receiver:
| Field Name | Parameter |
|---|
| Name | Specify a unique name, such as User Activity |
| Description | Specify a relevant description |
| Domain or IP Address | IP address of your Samurai Local Collector |
| TCP Port | 514 |
| TLS Encryption | Disabled |
| App Connector Groups | Select the group(s) related to the on-prem App Connector(s) that will forward data to the Samurai Local Collector |
Use the following parameters when completing the steps within the documentation under section 2. Log Stream:
| Field Name | Parameter |
|---|
| Log Type | User Activity |
| Log Template | JSON |
| Policy | Select |
Create Additional Log Receivers
A log receiver is required for each log type. Complete the Log Receiver Configuration steps outlined above for each log type listed below. Where User Activity is referenced in the previous section, replace it with the log types
listed below:
For integrations that utilize a Local Collector where we ingest syslog only, you do not need to follow specific steps in the SamurAI MDR portal as we auto detect the vendor and product. The only reason you need to use the SamurAI MDR portal is if you need to determine the Local Collector IP address. Of course you will still need to ensure the integration is functioning! See Integrations for more information on checking status.
Our Integration guide was accurate at the time of writing but vendors change things frequently! If you find errors or anything is outdated, let us know by raising a request in the SamurAI MDR Portal and we shall get it updated.
9 - Assistant
The Assistant is an AI-powered documentation assistant to quickly find information from official documentation directly within the SamurAI Portal.
It enables SamurAI Portal users to ask natural language questions and get accurate, contextual answers drawn solely from SamurAI documentation.
The Assistant is designed to make it faster and easier to find setup instructions, feature explanations, and guidance without leaving the SamurAI Portal.
Key Benefits
- Instant answers - quickly get relevant information from SamurAI documentation
- Natural language support - ask questions as you would a person
- Time saving - No need to manually search or navigate multiple documentation pages
How it works
- The Assisant is trained exclusively on this documentation site
- It does not access or have access to client data or personal information
- It uses AI natural language understanding to summarize or direct you to the most relevant documentation pages
- It is automatically updated to include revised or new documentation
- It operates securely within the SamurAI Portal - no external AI services are used
Example Questions
- How do I validate the status of my local collector?
- What is Advanced Query and its purpose?
- What is the Samurai platform?
Access the Assistant
Login go the SamurAI Portal
Click on Assistant in the main menu.
Limitations
- As with any LLM-based system, the Assistant may occasionally produce inaccurate or incomplete responses. Users should validate outputs, as AI can make mistakes.
- Questions are limited to 250 characters to encourage concise queries and prevent long-form text input.
- The Assistant does not retain memory of previous questions or interactions. Each query is treated independently, meaning it cannot reference or build upon earlier conversations. For continuity, users should include relevant context in each new question.