Advanced Query
Advanced Query provides a powerful interface that enables you to query your event data ingested into the Samurai platform. For instance, you can query for matching events which were logged or triggered in the past in order to fully understand the context.
After a threat has been responded to, Advanced Query can also play an important role in the forensic investigation of the threat, in order to determine both its extent and the sequence of events which occurred.
Advanced Query provides a very flexible interface which is based on Microsoft’s Kusto Query Language (KQL). This means that you can perform tasks ranging from simplistic queries all the way through to complex and powerful threat hunts in search of evasive threats.
The Advanced Query interface provides you with a graphical view showing the distribution of query matches over time. This allows you to easily spot deviations from the norm, and to identify the time when important events occurred.
Some examples of the functionality provided by Advanced Query include:
- Ability to use the KQL query language to cover simplistic searches across your data to running complex queries in support of Threat Hunting activities.
- Ability to query the Samurai data lake for events over the entirety of your full retention period.
- Ability to provide a time-based visualization of the results matching your query enabling you to spot deviations from normal activity.
- Ability to easily filter in/filter out values.
- Ability to easily drill in and out using a graph of the overview, enabling you to quickly pivot across anything from small result sets, to ones containing millions of data points.
- Ability to query over a user-defined time period.
- Ability to easily search/filter the results and export the selected results.
Some example use cases, which can be covered by Advanced Query include:
- Verifying activity of an endpoint over a specified time period
- Tracking lateral movement of a threat actor
- Finding other endpoints which may have been affected by a breach
- Tracing the sequence of events in a breach
- Find all activity related to a specific attacker
- Confirming that new log sources are generating data and verify these are configured correctly.
The Advanced Query user interface is divided into a number of panes which provide:
- A time-picker allowing the user to easily select a time-period to apply a query.
- An interactive KQL query editor.
- A filters panel, reflecting all the Fields available in the current result. This allows you to quickly filter in/out, search across the filter values and visually see the split between various values. This also allows you to quickly narrow down a query.
- A Results panel, showing all matching Alert and Event data, both in parsed and raw format. This allows you to easily search and filter cross the viewed result and export results of relevance.
- A User Tips panel, showing some quick Tips to assist the user in getting started in writing their first KQL queries.
To learn all about the feature within the Samurai MDR application please review Advanced Query Functionality.
1 - Advanced Query Functionality
Advanced Query allows you to query all of your telemetry data ingested into the Samurai platform using Microsoft’s Kusto Query Language (KQL). You can use KQL to perform simple exploration of your data through to sophisticated threat hunting in search of security anomalies and evasive cyber security threats.
In this article we provide an overview of each element of the interface within the Samurai MDR application and its’s usage to enable you to maximize your query results.
Navigate to the Advanced Query Interface
- Login to the Samurai MDR application
- Click Advanced Query located on the main menu

Figure 1: Advanced Query interface
Advanced Query Panels
Query Panel
The Query panel is where you write KQL queries. As you construct a query the interface auto-completes suggesting operators or schema.

Figure 2: Query panel auto-complete example
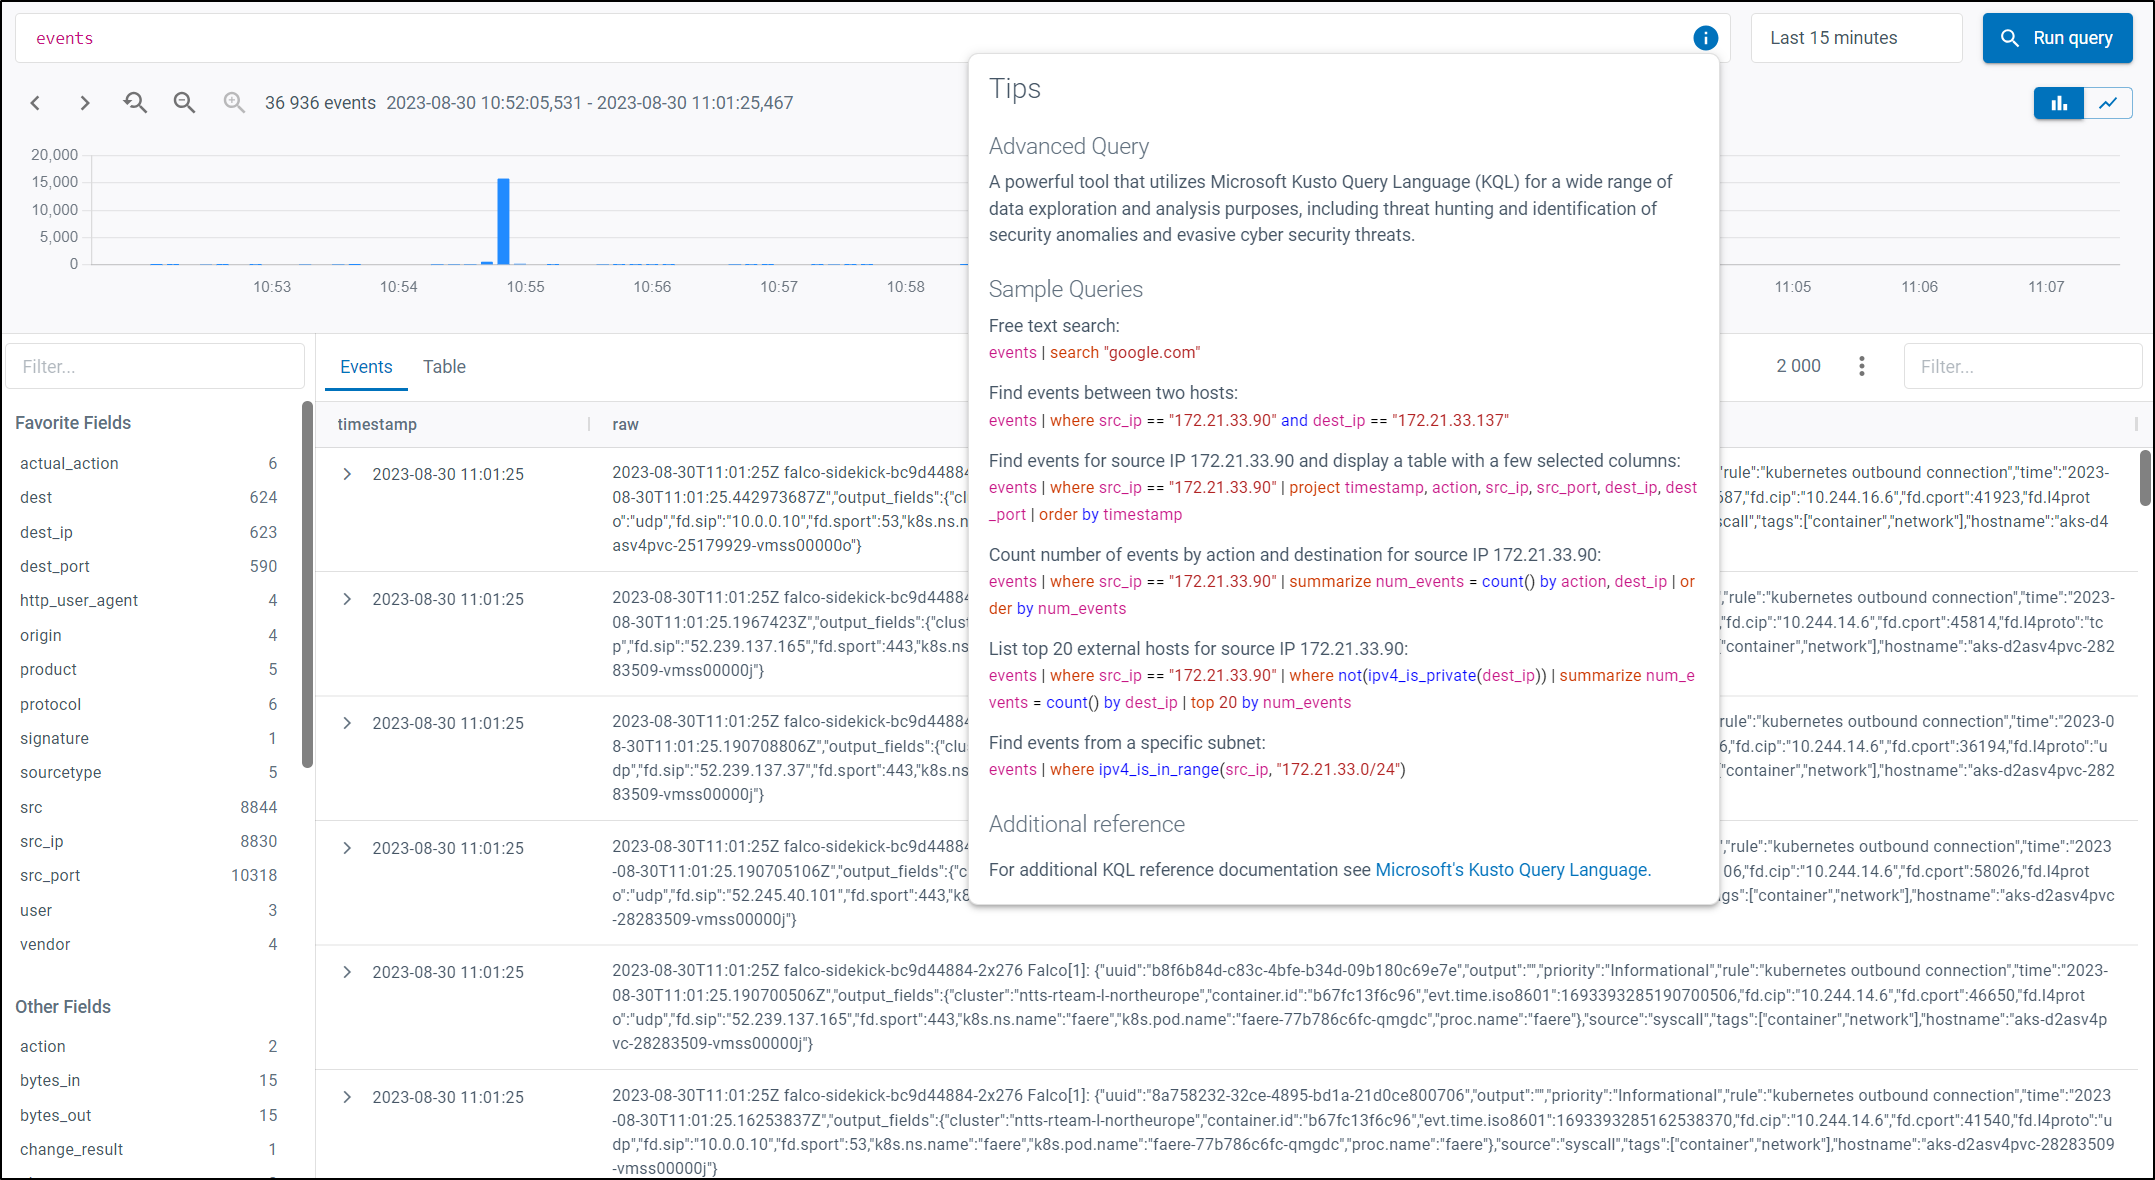
 Click KQL quick reference for a list of operators/functions and their descriptions. You can also access our Tips by selecting the information icon (
 ).
).

Figure 3: Advanced query Tips
Once you have completed writing your query click Run Query

Figure 4: Run Query
Time Period
Any query you run is based on a time period. Select a relevant time period when constructing a query to display results based on this time period.
If you use a timestamp operator within a query, the Time Period will be overridden and be viewed as ’Set in Query’.

Figure 5: Time period
Query History
To view your historical queries click ( ). This displays the latest 50 queries executed by you with time of execution and an option to add the query to a library. To save the query to a library, click (
 ) .For more information on saving a query jump to Save New Query.

Figure 6: Query history
Query Library
A library is where queries are saved for future use. There are different types of query libraries:
- Standard library - useful queries provided and populated by NTT.
- Organization library - queries saved within folders are available to any of your organization’s users with access to the MDR web application.
- My library - queries saved within folders are only available to you.

Figure 7: Query library
Within ‘Organization library’ and ‘My library’ you can create folders to categorize and save your queries.
Save New Query
Click Add to save a query and select the Folder to save it in (you can also create a new folder here). You can optionally add a Description and MITRE ATT&CK category from the prepopulated list.
Once complete click Save.

Figure 8: New query
Edit/Duplicate/Delete Queries
Click more options ( ) if you need to edit or duplicate existing queries to refine them or alternatively delete.

Figure 9: Edit, duplicate and delete options
Editing or deleting queries in the ‘Organization Library’ will be seen by all users of your organization so be careful to ensure queries are not lost.
Fields Panel
The Fields panel displays all fields available based on the query. By default we query the events table which displays all fields available from your telemetry, this is divided into Favorite Fields and Other Fields.
 Apply a filter to the fields by typing in the Filter window.
Each Field displays a count which represents the hits within the entirety of the query result.

Figure 10: Fields and count
By selecting a Field you can expand on the values within that field. For example, the graphic below highlights the ‘dest_ip’ field which displays all values with a Count and percentage of total

Figure 11: Field selection showing values
Samurai has default Favorite Fields, however you can update your Favorite Fields by selecting the Field and either select or deselect as a favorite by clicking  .
.
 Samurai prioritizes processing of Favorite Fields over Other Fields to optimize results and improve efficiency. Therefore activating ‘Favorite’ on a field will result in the data collection and count being prioritized and returned faster. Conversely, deactivating Favorite on Fields may also increase overall performance of the Favorite section.
To simplify query building you have the ability to select one or more values when you expand the field using the “+ - " symbols, this appends the value to include (==) or exclude (!=) from the query.

Figure 12: Add value to query
 Based on the field you also have the ability to search and check the value against VirusTotal and/or AbuseIPDB (Click on the links to learn more). You can check public IP addresses against both databases or domain/filehash/url against VirusTotal.
Results Overview Panel
Query results are presented in a graphical overview, this may allow you to visually identify patterns or deviations in the results. The graph takes into consideration selected time-period, number of results matching the query and is presented with date/timestamp and total for each bar in the graph. Hovering over any bar in the graph will display the date/timestamp and total results.

Figure 13: Graphical result overview
 Due to the way we process your telemetry, if your query includes the current time period there may be a slight delay in event data displayed in your results.
The graph is also interactive, by clicking on any bar in the graph or by left click selection and highlighting multiple bars, the Fields and Results Panel are adjusted to display data in the selected time-period. You can also zoom in to specific results by selecting Zoom to Selection ( )
)

Figure 14: Result selection
Additionally you can Zoom out ( ) from any result set to view a larger time-period in relation to the active result. The Zoom out increment is based on the time period between the first result and last result and added to the ‘from’ and ’to’ time.
For example: First result at 13:00 and Last result at 14:00, is a 1 hour time difference. If you Zoom out this adjusts the time period 1 hour, therefore , 13:00, updates to 12:00 and 14:00 adjusts to15:00. Increasing the viewed time-period from 1 hour, to 3 hours.
By default a column chart type is displayed, however you also have the options to select from multiple chart types options, based on the chart type.

Figure 15: Chart types
 If you wish to display results in an alternative chart type it is recommended to narrow down and refine your query through time period, fields and filters as visualizing results in a large data set may cause a ’too many data points’ notification.
Results Panel
The results panel displays an Events view (with timestamp and raw data) or Table view (with all events displayed in rows and each field in columns). The results panel will display up to 2000 results.

Figure 16: Results panel
 To optimize user experience and performance Samurai limits the results panel to a maximum of 2000 results. 2000 results could be a subset of a much larger result set based on your query, in these cases we recommend refining your query by adjusting the time period or adding specific filters - after all you would not want to review results which could potentially be in the 10’s or 100’s of thousands!
Results Panel Options
By selecting more options ( ) displayed on the top right of the the result panel you can:
- Show favorite fields
- Show empty fields
- Autosize visible columns
- Clear all filters
- Clear all sorting
- Export to CSV - export the results displayed to CSV. This functionality takes into consideration result selections and active filters making it very easy to export specific results.

Figure 17: Results panel options
Expand the Result
You can view all event data in a vertical view by selecting expand ( ) in both Event and Table views.
Filter the Result
You can create filters against any of the results by selecting ( ) and choosing a filter option and parameter.

Figure 18: Filter options
You can also easily filter results from the Filter located at the top right of the Results Panel.
Filter / Copy based on value
By selecting more options () on any given field result you can copy to clipboard ( ) or Add or Exclude filter to your query.

Figure 19: More options
 When adding or excluding a specific field result to your query, Samurai attempts to automatically update the KQL query for you to run again!
What’s Next?
If you are new to KQL please refer to Constructing an Advanced Query or for comprehensive documentation refer to Microsoft KQL documentation.
2 - Constructing an Advanced Query
The Advanced Query feature within the Samurai MDR application uses Microsoft’s Kusto Query Language (KQL). In this article we discuss the basics of KQL, the logic of a query and provide some examples to get you started.
What is KQL?
In short, KQL is as it states, a Query Language.
The “K” in KQL (Kusto) is named after Jacques Cousteau, the infamous ocean explorer! Just like Jacques’s exploration into the depths of the oceans, finding previously unknown volcanic basins, KQL provides you the ability to explore the expanse of your telemetry data.
Why and when use KQL?
Of course, you are not going to find any volcanic basins or new species of dolphin in your data, however in the cybersecurity context it will allow you to find actionable information. Use of KQL will allow you to investigate your data to answer simple questions such as ‘is my log source generating data’ through to tracing the sequence of events in a breach. You may be familiar with the term Threat Hunting, effectively searching for malicious, suspicious or nefarious activity - whether that be proactive via determining a hypothesis through to hunts based on Indicators of Compromise (IOCs) and Indicators of Attack (IOAs). In essence, using KQL helps you answer the following questions:
- Does X exist
- Where does X exist?
- Why does X exist?
- How to respond?
KQL Logic
A typical query is structured to search, locate information and produce results.
The structure may include:
- What? table to query
- Pipe (|) for command separation
- Filter
- Order data
- Modify Columns in results
Lets walk through some simple examples to understand the logic.
Find events between two hosts
events | where src_ip == "10.170.236.50" and dest_ip == "10.179.236.106"
- The first step in this query outlines what to query, in this example it is the “events” table. By default Samurai always queries the “events” table.
- The pipe ( | ) command is always used for command separation.
- We then use a ‘where’ operator to filter within the query for the source ip address (src_ip) of “10.170.236.50” and a destination IP address (dst_ip) of “10.179.236.106”
When looking at the results of a query, you will be presented with associated Fields based on the query which allows you to narrow down your search. KQL query statements work like a funnel, starting with a large data set and passing it through multiple operators until it is filtered, summarized or rearranged as required.
By selecting a Favorite Field or Other Field you can start to narrow down your results to your requirements. Alternatively you may choose to include the fields within the query itself or use the ***Project operator ***to include specific column fields within your result.
Refer to Advanced Query Functionality to understand more on Favorite Fields and Other Fields.
Search for events with source IP 10.170.236.50 and display a table with a few selected columns
 The pipe ( | ) command is always used for command separation
events | where src_ip == "10.170.236.50" | order by timestamp|project timestamp, action, src_ip, src_port, dest_ip, dest_port
- Query the ’events’ table
- Filter events using the where operator for source IP address “10.170.236.50”
- Use the order operator to order results by timestamp
- Use the project operator to include the column fields “timestamp, action, src_ip, src_port, dest_ip, dest_port”
The simple examples above make use of common operators, use the KQL quick reference guide for more info on operators which includes a comprehensive list with definitions.
Complex Examples
Lets now walk through some more complex examples.
Frequency of Events
A common requirement is to find the frequency of occurrence of an event. For instance, in this example we are reviewing Amazon VPC Flow logs and finding which destination IP addresses are receiving the most connections to port numbers below 1024.
events| where product == "Secure Firewall (FTD)" and toint(dest_port) <1024| summarize connections = count() by dest_ip |order by connections
What is also worth noting in this example is that we first need to convert the destination port number to an integer type (as it is a text field) before checking if it is a low-numbered port (less than 1024). For more information on the data types used in the data lake, you can refer to the article on event field data types.
This query produces output which looks something like this:

The result helps us to see which IP addresses are accepting the most connections to privileged ports.
Querying raw logs
Advanced Query isn’t only able to query logs from sources which originate from supported integrations. The fact that logs from any kind of syslog source can be ingested into the Samurai platform makes it possible to query the raw content of these logs using Advanced Query.
In the example below, we are taking authentication logs from a host, and querying for failed authentication attempts. We are able to use the extend operator and extract function to create our own fields from the log lines, parsing them using regular expressions.
events| where host == "10.1.1.1" and (raw contains "Invalid" or raw contains "fail") and raw !contains "connect"| extend message = substring(raw,16)| extend src_host = extract("([A-Za-z0-9\\-]+).+",1, message)|extend msg_info = extract("\\[[0-9]+\\]\\:(.+)",1, message)| extend app_src = extract("[A-Za-z0-9\\-]+([a-zA-Z0-9\\-]+).+",1, message)| extend user = extract("([A-Za-z0-9\\-]+) from",1, msg_info)| extend src_ip = extract("from([0-9a-f\\.\\:]+)",1, msg_info)| project timestamp, host, src_host, app_src, user, src_ip, msg_info| summarize attempts = count()by src_ip| order by attempts
Once we have extracted the fields we want, we can then go on to perform more operations. In this case we are summarizing the logs by counting the failed authentication attempts by source IP address, and ordering the list so that the IP address with the most failed attempts is listed first. In this case, this helps us to find potential brute force attackers who are trying to guess passwords through brute force tactics.
Tips!
Be Specific when constructing queries!
Used correctly, Advanced Query can perform sophisticated queries matching against a data set measured in terabytes within seconds! However poorly constructed queries can cause problems, cause dreaded browser slowdowns, or even trigger a query time-out when exceeding the maximum allowed query wait time. The more specific you are with your query, the quicker you are able to will get to the Result.
 Refer to the Microsoft documentation Query Limits for further information on limitations.
Lets look at an example:
- Try not run a query with no criteria (for example simply ‘events’) against a long timer period. Whilst this might be tempting to view all events, this will match ALL events in your Samurai tenant, delivering a sub optimal experience - results for such a query could potentially be measured in Gigabytes or at times Terabytes!
Instead, try to be as specific as possible:
- If you are querying activity for a specific source host, add a where statement specifically asking for results from a specific source:
events where src == "172.21.33.99"
events where src == "172.21.33.99" and type == "WEBPROXY"
events | where src == "172.21.33.99" and type == "WEBPROXY" | project timestamp, src, url
- Example:
- matching results: 3 700 000 events
- Approx time to completion: Full Results in 7 seconds
What Now?
As you may have realized from reading this article, Advanced Query is a powerful tool - only limited by your own understanding of KQL and in determining what questions or hypothesis against your data you may have. We recommend you start by writing a few simple queries and review the Microsoft documentation. If you need a reminder of usage in the Samurai MDR application, be sure to review Advanced Query Functionality.
3 - Event field data types
When using Advanced Query to analyze Events stored in the data lake, it is sometimes necessary to be aware of the data types of the fields of the records being processed.
For instance if you want to perform a numeric comparison on the value of a field, you need to ensure that it has a numerical data type (such as an integer) or otherwise type-cast it first. For instance, in the following example, we are testing for privileged port numbers (below 1024), but the dest_port field is a string:
events| where product == "VPC Flow Logs" and toint(dest_port) < 1024
Here we are using the toint() statement to convert the dest_port field to an integer before making a numerical comparison.
This raises the question of how to determine the data types of fields. You can use the getschema statement to display the data types of fields. The following query will display the types of the fields of the entire schema:
events | getschema
This example produces output something like this:

To find the type of a specific field, you can use the search bar above the output:

This example selects all the fields whose names contain the substring “port”.
If you know the name of the field whose type you want to query, you can use the project statement to filter out only that field:
