Advanced Query allows you to query all of your telemetry data ingested into the Samurai platform using Microsoft’s Kusto Query Language (KQL). You can use KQL to perform simple exploration of your data through to sophisticated threat hunting in search of security anomalies and evasive cyber security threats.
In this article we provide an overview of each element of the interface within the Samurai MDR application and its’s usage to enable you to maximize your query results.
Navigate to the Advanced Query Interface
- Login to the Samurai MDR application
- Click Advanced Query located on the main menu
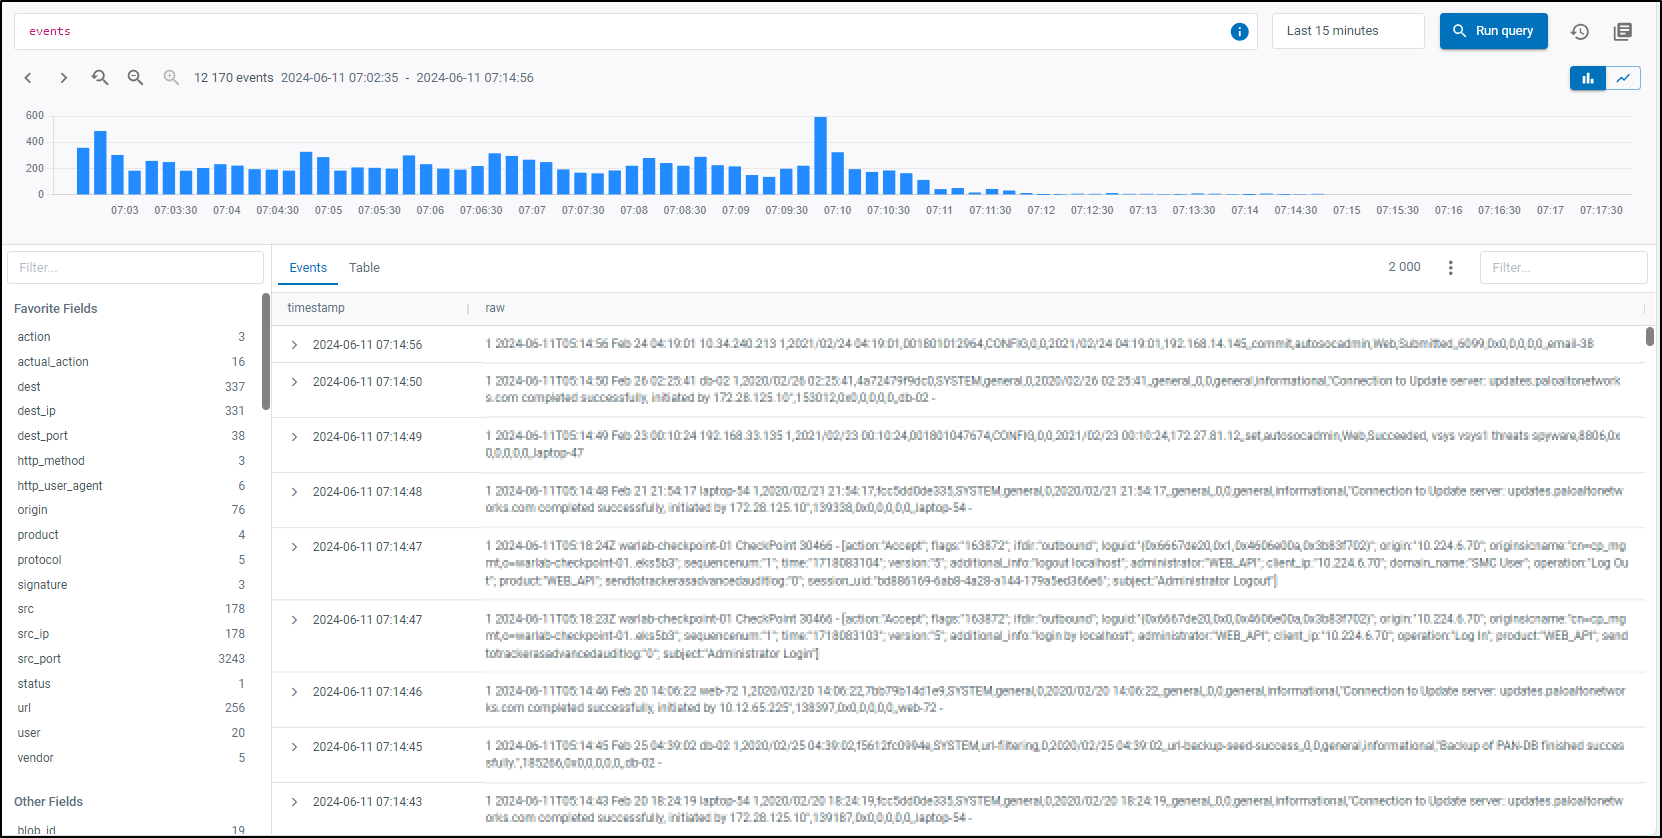
Figure 1: Advanced Query interface
Advanced Query Panels
Query Panel
The Query panel is where you write KQL queries. As you construct a query the interface auto-completes suggesting operators or schema.
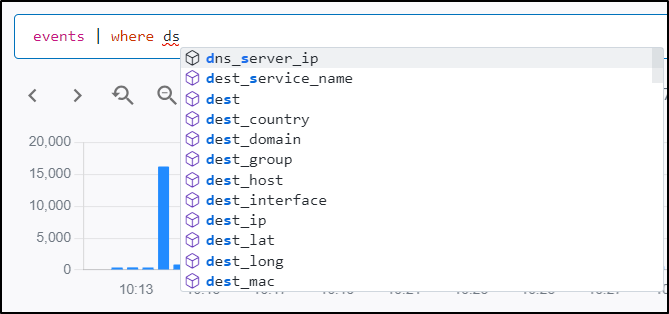
Figure 2: Query panel auto-complete example
 Click KQL quick reference for a list of operators/functions and their descriptions. You can also access our Tips by selecting the information icon (
![]() ).
).
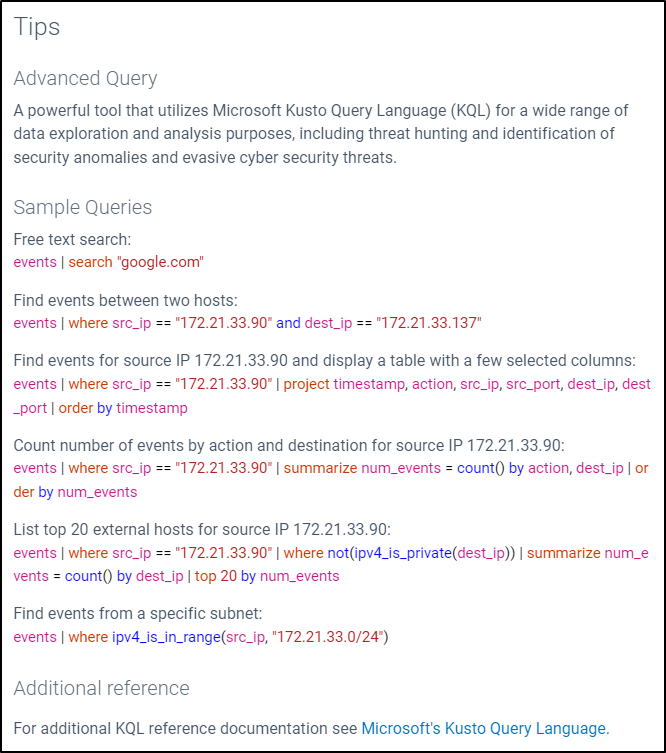
Figure 3: Advanced query Tips
Once you have completed writing your query click Run Query

Figure 4: Run Query
Time Period
Any query you run is based on a time period. Select a relevant time period when constructing a query to display results based on this time period.
If you use a timestamp operator within a query, the Time Period will be overridden and be viewed as ’Set in Query’.
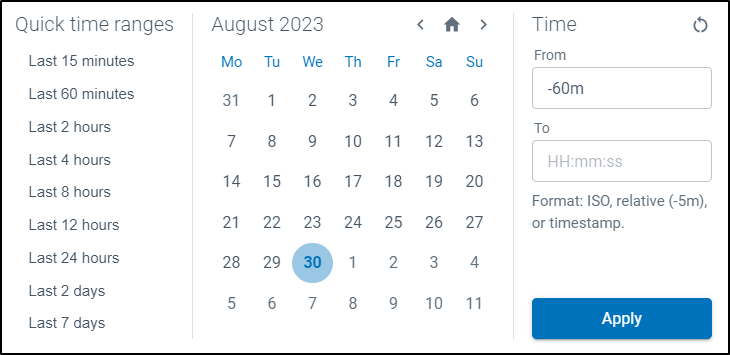
Figure 5: Time period
Query History
To view your historical queries click (![]() ). This displays the latest 50 queries executed by you with time of execution and an option to add the query to a library. To save the query to a library, click (
). This displays the latest 50 queries executed by you with time of execution and an option to add the query to a library. To save the query to a library, click (![]() ) .For more information on saving a query jump to Save New Query.
) .For more information on saving a query jump to Save New Query.
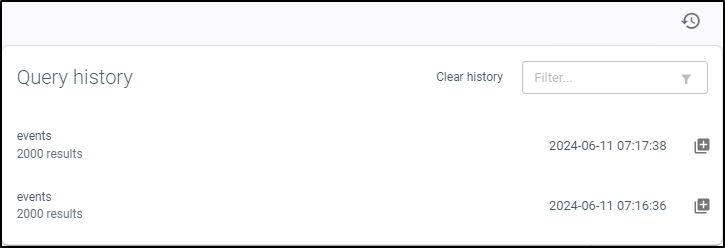
Figure 6: Query history
Query Library
A library is where queries are saved for future use. There are different types of query libraries:
- Standard library - useful queries provided and populated by NTT.
- Organization library - queries saved within folders are available to any of your organization’s users with access to the MDR web application.
- My library - queries saved within folders are only available to you.
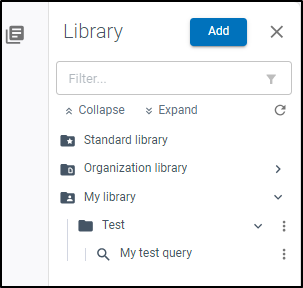
Figure 7: Query library
Within ‘Organization library’ and ‘My library’ you can create folders to categorize and save your queries.
Save New Query
Click Add to save a query and select the Folder to save it in (you can also create a new folder here). You can optionally add a Description and MITRE ATT&CK category from the prepopulated list. Once complete click Save.
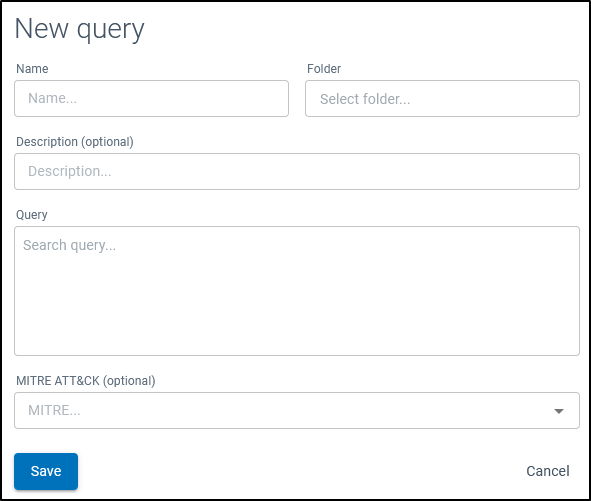
Figure 8: New query
Edit/Duplicate/Delete Queries
Click more options ( ) if you need to edit or duplicate existing queries to refine them or alternatively delete.
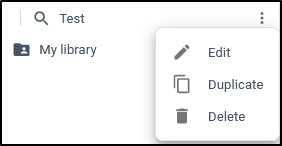
Figure 9: Edit, duplicate and delete options
Editing or deleting queries in the ‘Organization Library’ will be seen by all users of your organization so be careful to ensure queries are not lost.
Fields Panel
The Fields panel displays all fields available based on the query. By default we query the events table which displays all fields available from your telemetry, this is divided into Favorite Fields and Other Fields.
 Apply a filter to the fields by typing in the Filter window.
Each Field displays a count which represents the hits within the entirety of the query result.
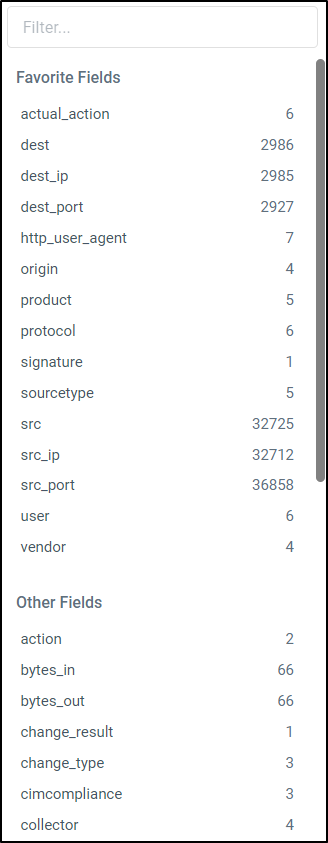
Figure 10: Fields and count
By selecting a Field you can expand on the values within that field. For example, the graphic below highlights the ‘dest_ip’ field which displays all values with a Count and percentage of total
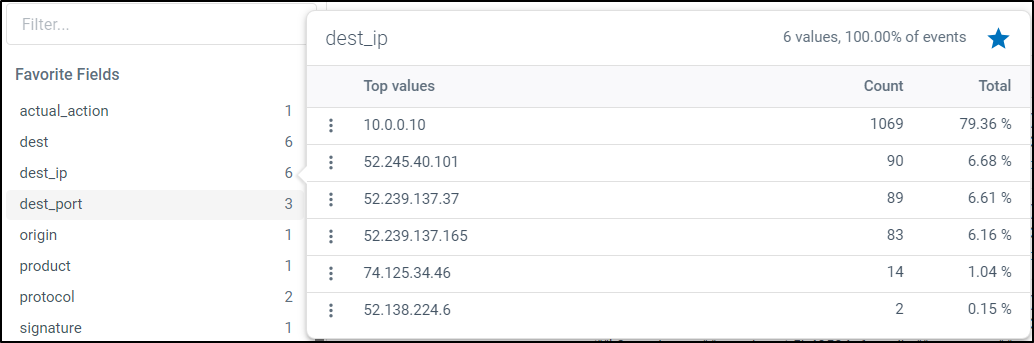
Figure 11: Field selection showing values
Samurai has default Favorite Fields, however you can update your Favorite Fields by selecting the Field and either select or deselect as a favorite by clicking  .
.
 Samurai prioritizes processing of Favorite Fields over Other Fields to optimize results and improve efficiency. Therefore activating ‘Favorite’ on a field will result in the data collection and count being prioritized and returned faster. Conversely, deactivating Favorite on Fields may also increase overall performance of the Favorite section.
To simplify query building you have the ability to select one or more values when you expand the field using the “+ - " symbols, this appends the value to include (==) or exclude (!=) from the query.
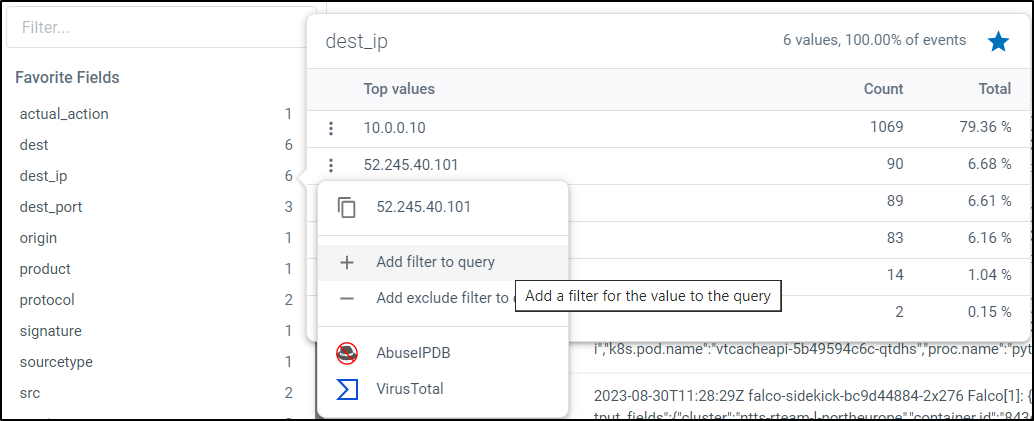
Figure 12: Add value to query
 Based on the field you also have the ability to search and check the value against VirusTotal and/or AbuseIPDB (Click on the links to learn more). You can check public IP addresses against both databases or domain/filehash/url against VirusTotal.
Results Overview Panel
Query results are presented in a graphical overview, this may allow you to visually identify patterns or deviations in the results. The graph takes into consideration selected time-period, number of results matching the query and is presented with date/timestamp and total for each bar in the graph. Hovering over any bar in the graph will display the date/timestamp and total results.
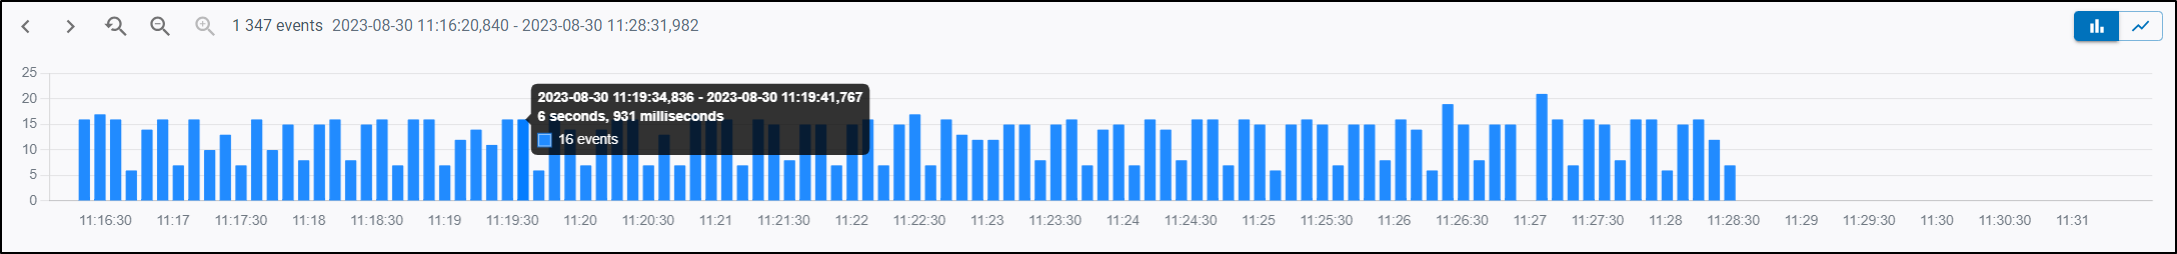
Figure 13: Graphical result overview
 Due to the way we process your telemetry, if your query includes the current time period there may be a slight delay in event data displayed in your results.
The graph is also interactive, by clicking on any bar in the graph or by left click selection and highlighting multiple bars, the Fields and Results Panel are adjusted to display data in the selected time-period. You can also zoom in to specific results by selecting Zoom to Selection (![]() )
)
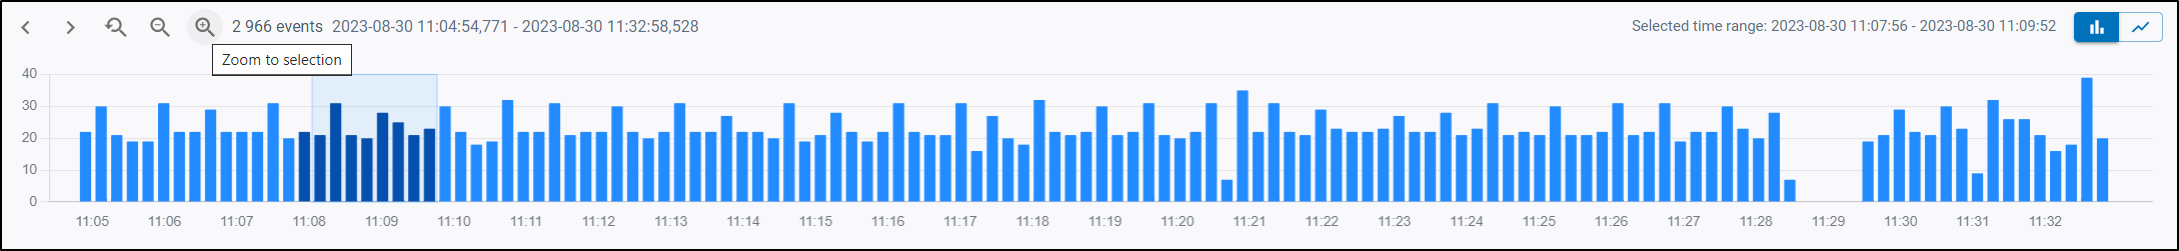
Figure 14: Result selection
Additionally you can Zoom out (![]() ) from any result set to view a larger time-period in relation to the active result. The Zoom out increment is based on the time period between the first result and last result and added to the ‘from’ and ’to’ time.
) from any result set to view a larger time-period in relation to the active result. The Zoom out increment is based on the time period between the first result and last result and added to the ‘from’ and ’to’ time.
For example: First result at 13:00 and Last result at 14:00, is a 1 hour time difference. If you Zoom out this adjusts the time period 1 hour, therefore , 13:00, updates to 12:00 and 14:00 adjusts to15:00. Increasing the viewed time-period from 1 hour, to 3 hours.
By default a column chart type is displayed, however you also have the options to select from multiple chart types options, based on the chart type.
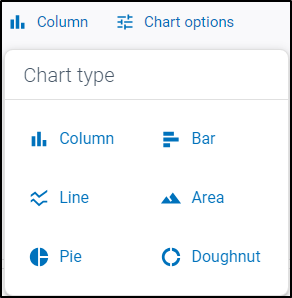
Figure 15: Chart types
 If you wish to display results in an alternative chart type it is recommended to narrow down and refine your query through time period, fields and filters as visualizing results in a large data set may cause a ’too many data points’ notification.
Results Panel
The results panel displays an Events view (with timestamp and raw data) or Table view (with all events displayed in rows and each field in columns). The results panel will display up to 2000 results.
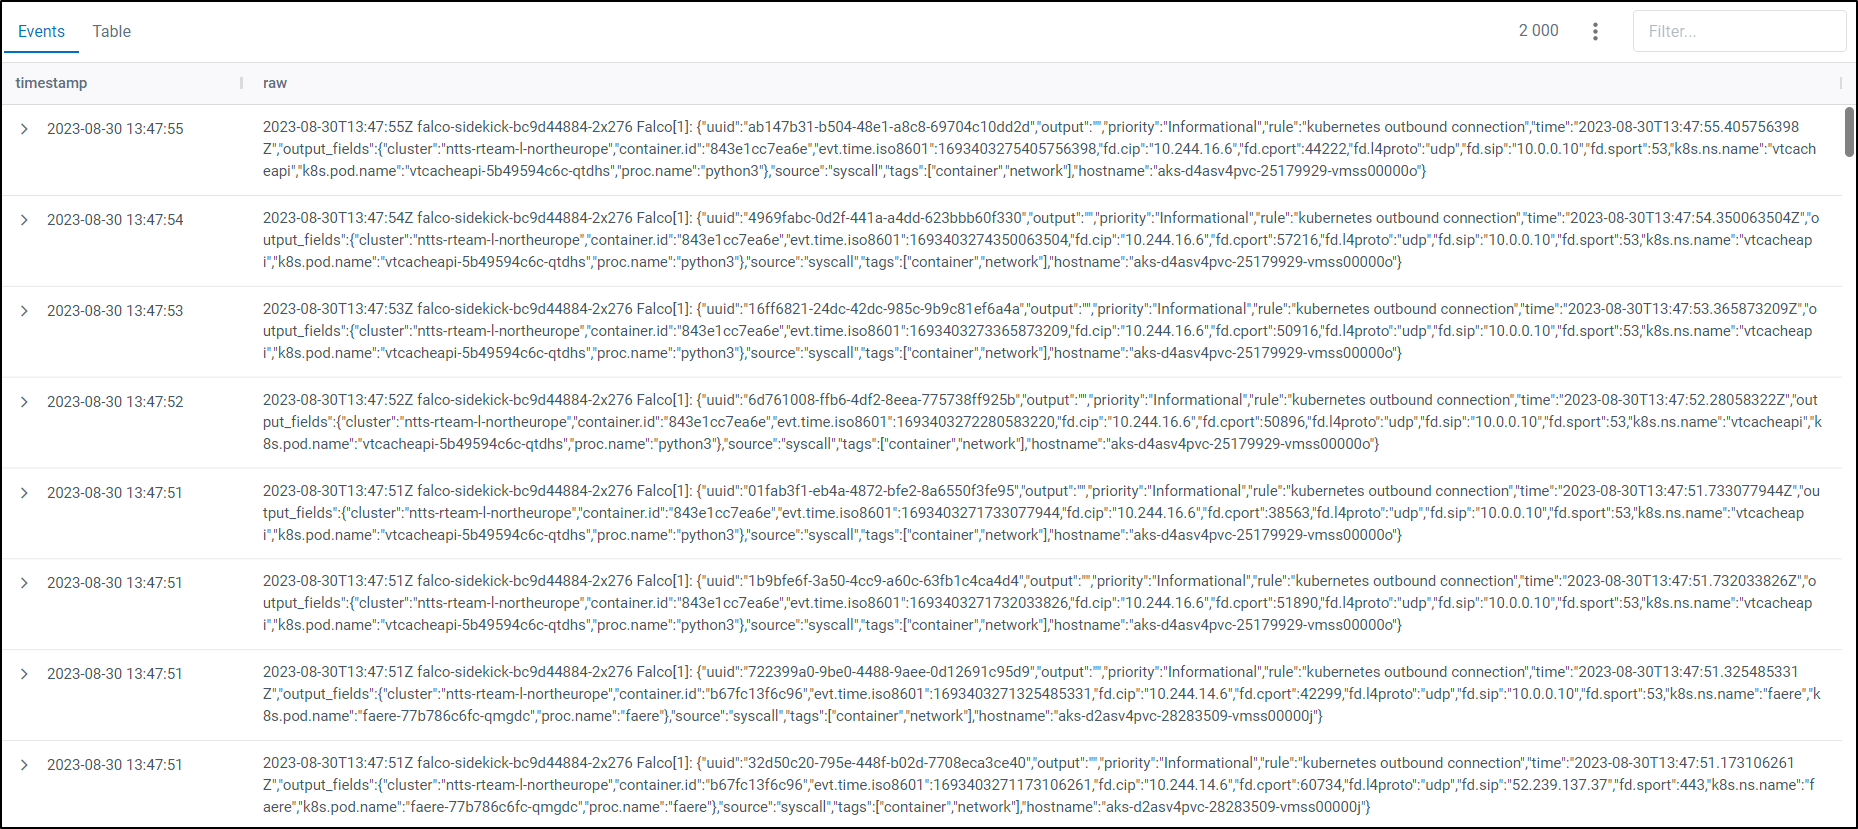
Figure 16: Results panel
 To optimize user experience and performance Samurai limits the results panel to a maximum of 2000 results. 2000 results could be a subset of a much larger result set based on your query, in these cases we recommend refining your query by adjusting the time period or adding specific filters - after all you would not want to review results which could potentially be in the 10’s or 100’s of thousands!
Results Panel Options
By selecting more options ( ) displayed on the top right of the the result panel you can:
- Show favorite fields
- Show empty fields
- Autosize visible columns
- Clear all filters
- Clear all sorting
- Export to CSV - export the results displayed to CSV. This functionality takes into consideration result selections and active filters making it very easy to export specific results.
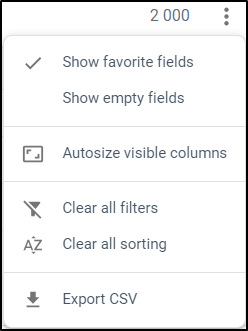
Figure 17: Results panel options
Expand the Result
You can view all event data in a vertical view by selecting expand ( ) in both Event and Table views.
Filter the Result
You can create filters against any of the results by selecting ( ) and choosing a filter option and parameter.
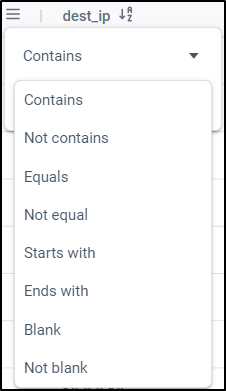
Figure 18: Filter options
You can also easily filter results from the Filter located at the top right of the Results Panel.
Filter / Copy based on value
By selecting more options () on any given field result you can copy to clipboard ( ) or Add or Exclude filter to your query.
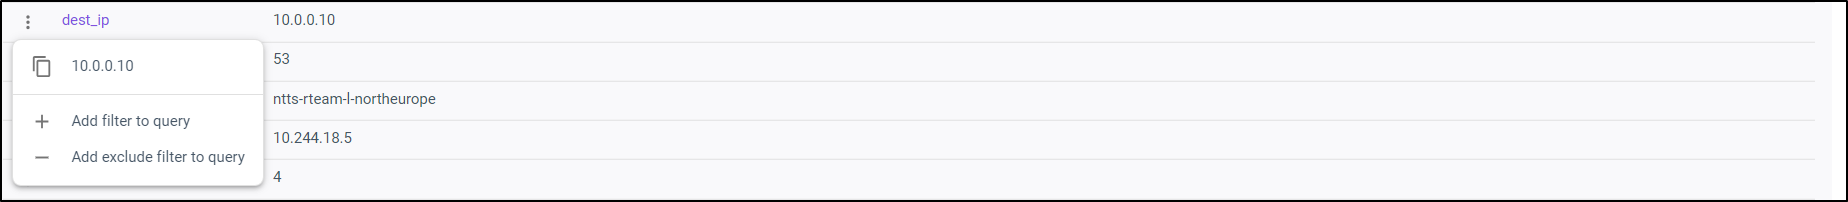
Figure 19: More options
 When adding or excluding a specific field result to your query, Samurai attempts to automatically update the KQL query for you to run again!
What’s Next?
If you are new to KQL please refer to Constructing an Advanced Query or for comprehensive documentation refer to Microsoft KQL documentation.