Alerts View
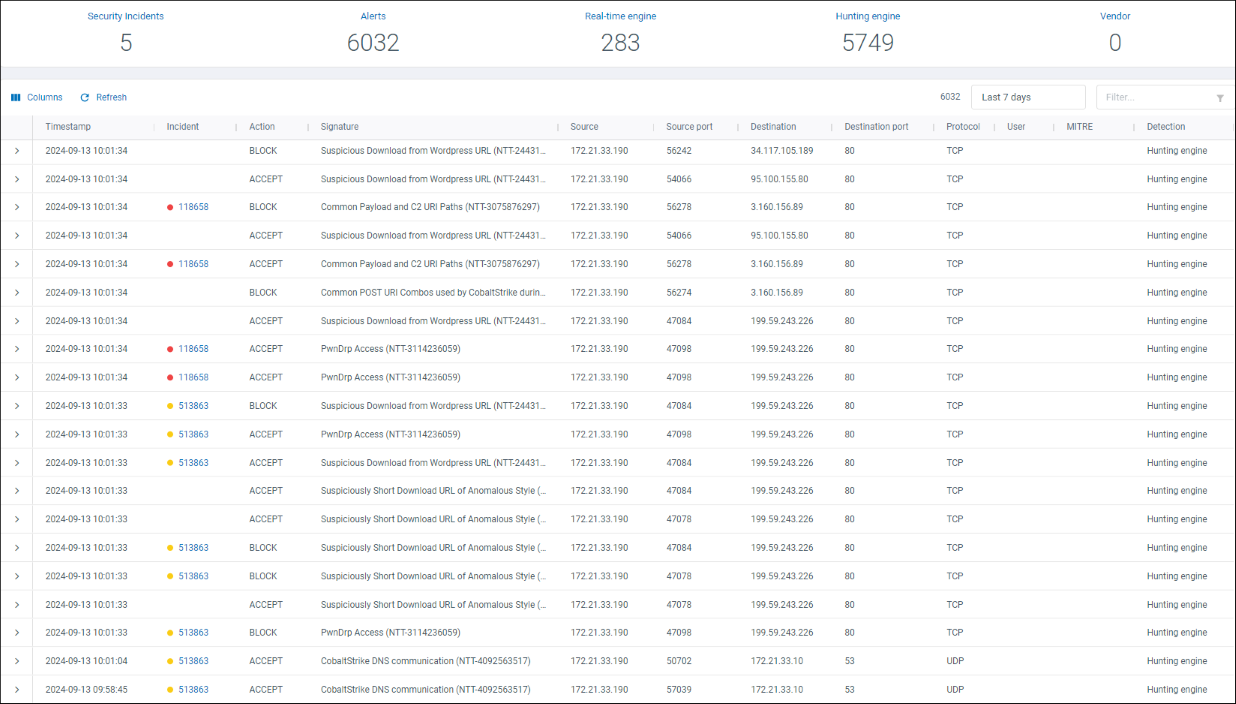
In this article, all elements of the Alert View are outlined to help you understand the alerts displayed.
Navigate to Alert View
- Login to the SamurAI Portal
- Click Analysis and select Alerts on the main menu

Figure 1: Alert view example
Alerts Summary
Alerts are summarized in a panel which can be updated based on a specified time period and includes:
- Security Incidents - the total number of security incidents reported to you that may correspond to one or more alerts.
- Alerts - the total number of alerts detected by the SamurAI platform and third party vendor integrated with the SamurAI platform.
- Real-time engine - the total number of alerts detected by the SamurAI real-time engine
- Hunting engine - the total number of alerts detected by the SamurAI hunting engine
- Vendor - the total number of alerts collected from third-party vendor products integrated with the SamurAI platform

Figure 2: Alerts summary example
Filters
Various filters are available to determine the alerts to be displayed.

Figure 3: Time and Display filter
The total number of alerts within the alerts table in displayed to the left of the Time Period filter.
Time period
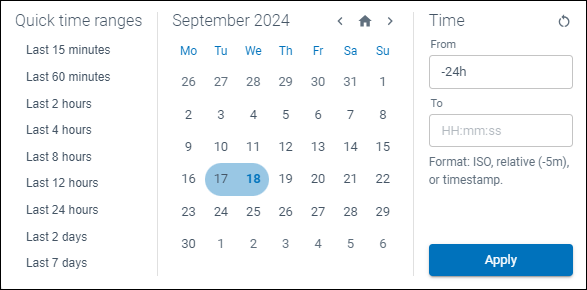
You can update all panels to specific date and time ranges. We default to the Last 24 hours however have included Quick time ranges.

Figure 4: Date and time selection
Display Filter
Enter any values you wish to filter and highlight within the display filter.

Figure 5: Display filter
Alert Column Filter
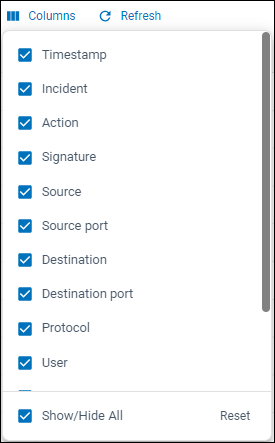
Adjust and show/hide any of the column values within the Alert Table.

Figure 6: Alert column filter
Alerts Table
All alerts are listed within the alert table, important to note is that the table is limited to 10,000 alerts therefore apply filters to narrow the results.
What are the Alert table fields?
Review the table below outlining each field displayed:
| Alert field | Description |
|---|---|
| Timestamp | Local date and time of when the alert was generated displayed in the format [yyyy:mm:dd] [hh:mm:ss], hover over will display Universal Time Coordinated (UTC) and local timezone offset |
| Incident | If the alert is associated with a reported security incident (one or more alerts may be associated with a single security incident) a link to the security incident is displayed |
| Action | Action relates to the parsed action in the underlying event(s) |
| Signature | Signature name from the detecting engine - this could be from an integrated telemetry source (vendor) or from a SamurAI platform detection engine |
| Source | Initiating source, this could be represented as hostname(s), IP address, user or URL |
| Source Port | The initiating source port |
| Destination | The destination, this could be represented as hostname(s), IP address, user or URL |
| Destination Port | Destination port number |
| Protocol | Network protocol e.g TCP / UDP |
| User | User from the underlying event(s) |
| MITRE | The MITRE ATT&CK tactic mapping - this could include one or more tactics. For further information refer to ATT&CK Matrix for Enterprise |
| Detection | The detection engine triggering the alert. Refer to How are alerts triggered? |
| ID | Alert ID (not displayed by default) |