The alerts dashboard provides valuable insights into your organization’s security landscape, despite all alerts being handled by the SamurAI Security Operation Center (SOC) it provides visibility into the volume of alerts which potentially lead to validated threats and reported to you as a security incident. Additionally we provide transparency by categorizing the alerts by detection engine and highlighting top threat signatures, whilst you do not need to act upon these alerts, this information demonstrates the SamurAI MDR service’s scale and effectiveness.
Outlined below are examples and an explanation of each panel within the dashboard:
Monitoring, Detection and Response summary
The funnel outlines telemetry ingested (events) by the SamurAI platform from your configured integrations, the security detections (alerts) made by the SamurAI platform detection engines and third party vendors which are triaged and investigated by the SamurAI SOC, and the number of security incidents reported to your organization. The funnel infers the value of the service based on the data analyzed focusing on detecting and reporting threats to your organization.
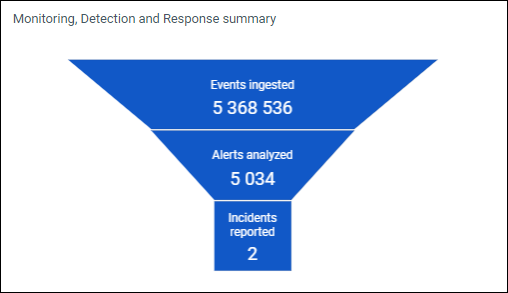
Figure 1: Example summary
Number of alerts
The total number of alerts analyzed by the SamurAI platform and SOC analysts.
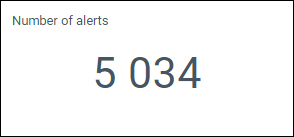
Figure 2: Example number of alerts
Number of unique signatures
The total number of unique alert signatures.
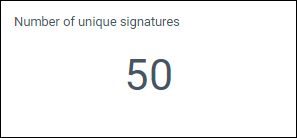
Figure 3: Example unique signatures
Alerts per detection method
Donut chart showing the alerts per detection method. For a brief explanation of the detection engines please refer to Alerts.
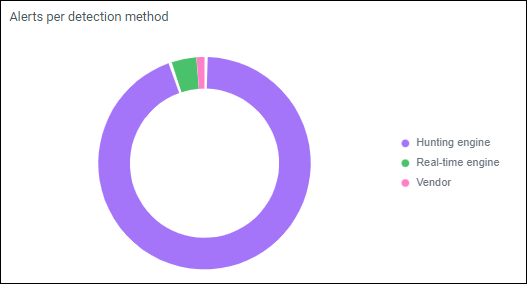
Figure 4: Example alerts per detection method chart
Alerts timeline per detection method
Bar graph showing alerts over the time period per detection method.
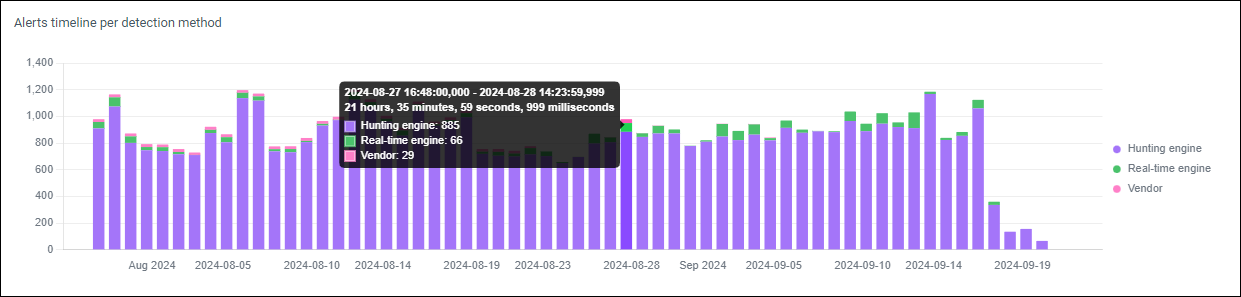
Figure 5: Example alerts timeline per detection method graph
Top 10 signatures
Top 10 alert signatures from all detection methods.
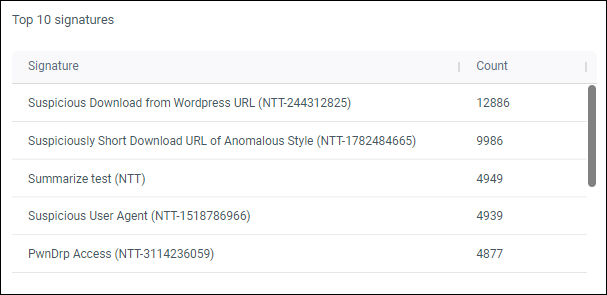
Figure 6: Example top 10 signatures
Top 10 signatures for Hunting Engine
Top 10 alert signatures for the SamurAI hunting engine.
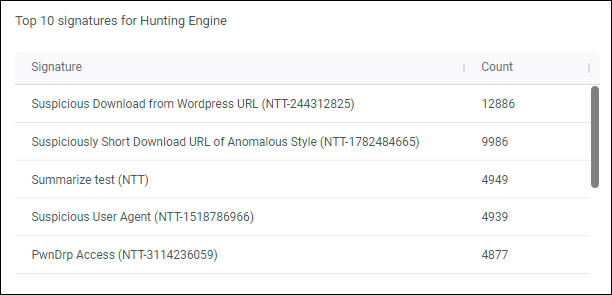
Figure 7: Example top 10 signatures for hunting engine
Top 10 signatures for Real-time Engine
Top 10 alert signatures for the SamurAI real-time engine.
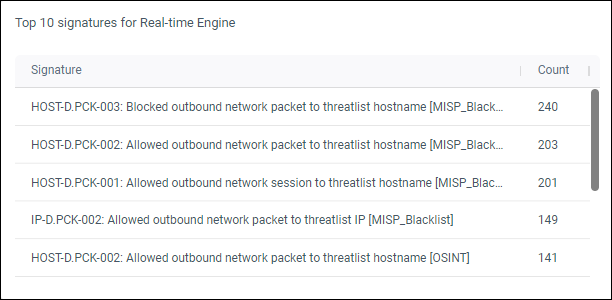
Figure 8: Example top 10 signatures for real-time engine
Top 10 signatures for vendor
Top 10 alert signatures from your vendor product integrations.
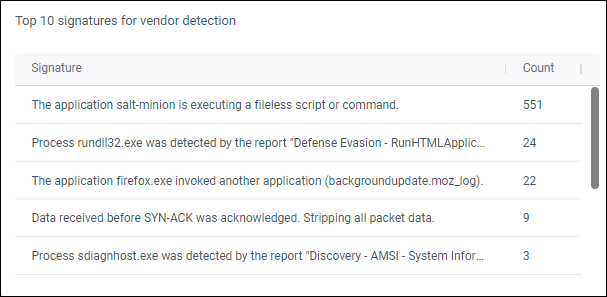
Figure 9: Example top 10 signatures for vendor