The Security Incidents dashboard provides a simple self explanatory high level view of your Managed Detection and Response service security incidents.
Current open security incidents per severity
For more information on severity definitions, refer to Security Incident Fields.
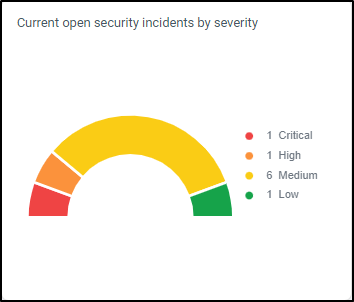
Figure 1: Example current open security incidents by severity
Current open security incidents by state
For more information on state definitions, refer to Security Incident Fields.
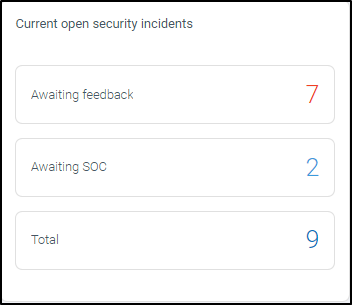
Figure 2: Example current open security incidents by state
Current open security incidents (days)
This graph helps you understand how long (in days) a security incident has remained open - this could be in ‘Awaiting feedback’ or ‘Awaiting SOC’ states. Ideally the goal is to remediate and close a security incident as quickly as possible to mitigate risk.
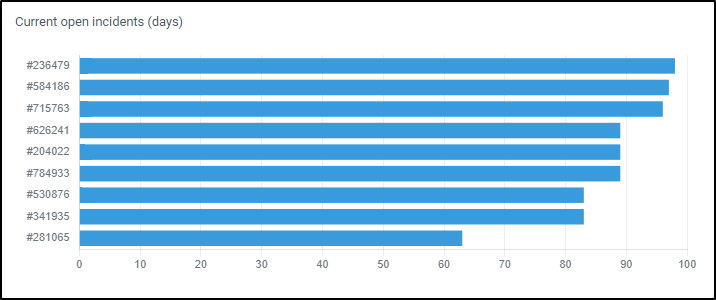
Figure 3: Example current open security incidents (days)
New security incidents per month by severity
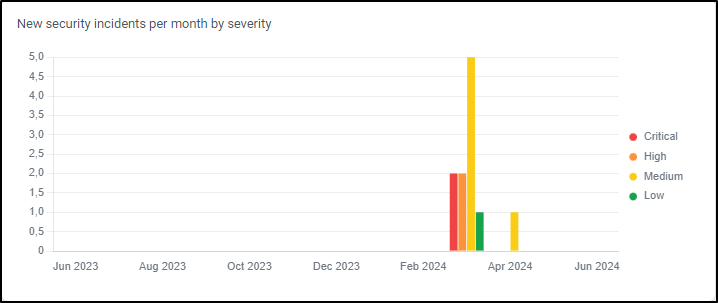
Figure 4: Example new security incidents per month by severity)
Security incidents average closing time by severity (days)
This graph shows the average closing time (in days) of security incidents per severity. Ideally the goal should be to keep this average closing down to a minimum.
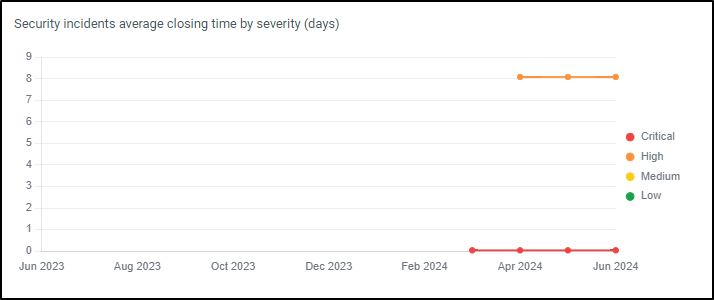
Figure 5: Example security incidents average closing time by severity (days))
Security incidents total opened/closed per month
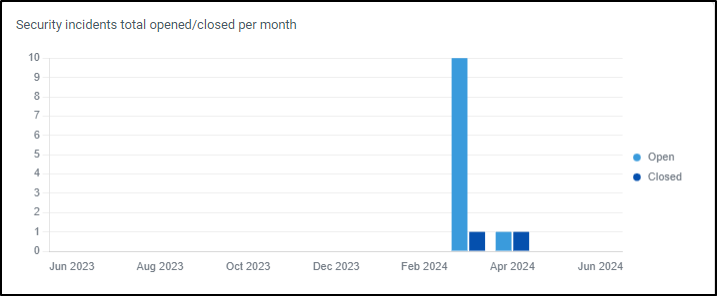
Figure 6: Example Security incidents total opened/closed per month))