The Telemetry dashboard provides a simple self explanatory high level view of your Managed Detection and Response service telemetry metrics.
Summary Panels
Within the dashboard are various summary panels which can be updated based on a specified time period and includes:
- Total number of events ingested into the SamurAI platform
- Total log volume
- Number of integrations (this is current state and not affected by the specified time period)
- Unhealthy integrations (these integrations likely need action, please review the Telemetry Monitoring article for further information)
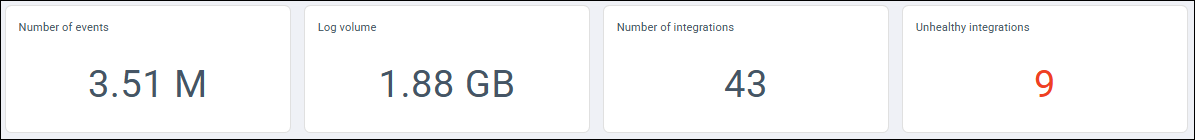
Figure 1: Example summary panel
Time period
You can update relevant panels to specific date and time ranges. We have included Quick time ranges or you can specify a date and time period.
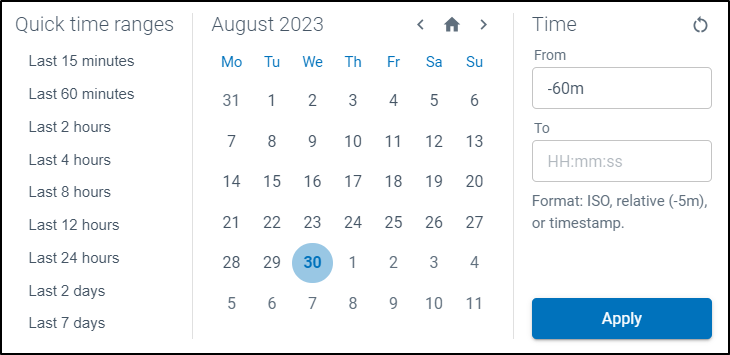
Figure 2: Date and time selection
Detail Panels
Additional panels provide event data based on products you have integrated with the SamurAI platform.
Events per product
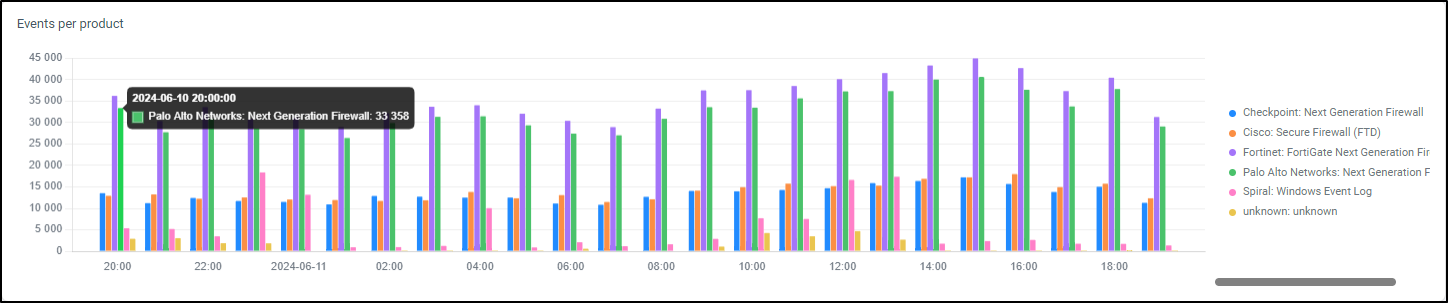
Figure 3: Example events per product bar graph
Events per product
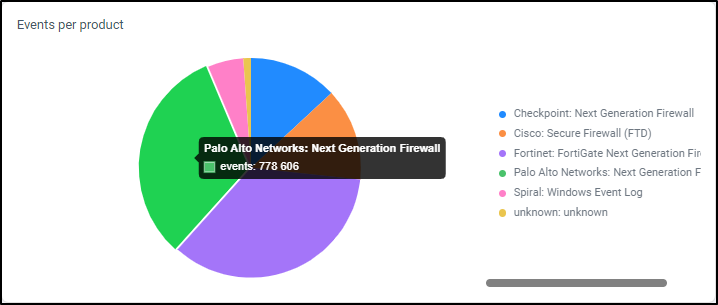
Figure 4: Example events per product pie chart
Data ingested per product
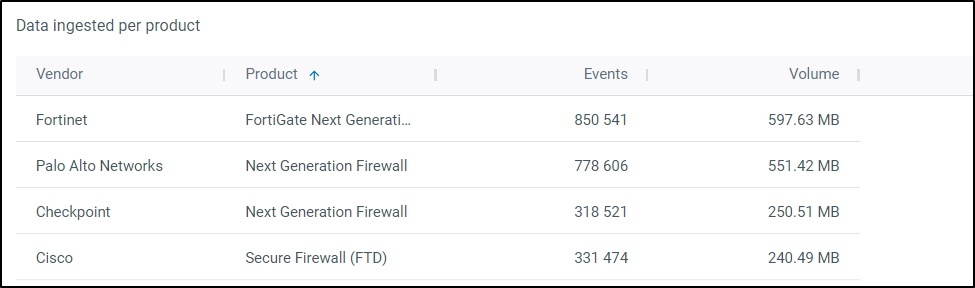
Figure 5: Example data ingested per product table
If you wish to drill down into the events we recommend you use the Advanced Query feature. Review Advanced Query Introduction for more information.