This is the multi-page printable view of this section. Click here to print.
Telemetry
- 1: Telemetry Monitoring
- 2: Integrations
- 2.1: Supported Integrations
- 2.2: Create
- 2.3: High Availability
- 2.4: Details and Status
- 2.5: Delete
- 2.6: Generic Log Sources
- 3: SamurAI Collectors
- 3.1: Local Collector
- 3.1.1: Requirements
- 3.1.2: Deployment
- 3.1.3: Local Collector Details
- 3.2: Cloud Collector
- 3.2.1: Deployment
- 3.2.2: Cloud Collector Details
- 4: Network Traffic Analyzer (NTA)
- 4.1: Requirements
- 4.2: Deployment
- 4.3: NTA Details
- 5: SamurAI Endpoint Agent
- 5.1: Support and Pre-requisites
- 5.2: Download and Installation
- 5.2.1: Download
- 5.2.2: Microsoft Windows
- 5.3: Management
- 5.3.1: Settings and Updates
- 5.4: Uninstall
- 5.5: FAQ
1 - Telemetry Monitoring
The Telemetry Monitoring view provides you a clear concise view of any integrations that have a status of Warning and Critical.
Access Telemetry Monitoring
- Click Telemetry in the main menu
- Select Telemetry Monitoring

Figure 1: Telemetry monitoring menu and visual indicator
Summary Panel
Telemetry Monitoring provides a summary of all integrations and their current status.

Figure 2: Example summary information
Possible status and their associated descriptions are outlined in the table below:
| Status | Description |
|---|---|
| Pending | Telemetry components installing / provisioning or awaiting status |
| Unknown | The SamurAI platform is unable to determine a status or the Vendor/Product are unknown |
| OK | All components healthy |
| Warning | Warning status will be displayed if the SamurAI platform has not seen any events per the defined threshold. |
| Critical | Critical status will be displayed and an email notification will be sent to registered users (by default) if the SamurAI platform has not seen any events per the defined threshold |
Telemetry Monitoring Table
The table lists all integrations for which the SamurAI Platform has not received events according to defined thresholds for Critical and Warning.
 Figure 3: Example detail table
Clicking on the Integration will navigate you to the Integration Details. For integrations of type Log an events graph will be displayed which may help in troubleshooting.
Additional Table Information
HA Group
- Represents integrations configured in High Availability (HA) mode (e.g. Active/Passive pairs)
- The best member state determines the group’s overall status
- Notifications are sent only for HA groups — not for individual members
- Refer to High Availability and Integrations
Unsupported integrations
- Displayed as Product - unknown and Vendor - unknown
- The SamurAI platform does monitor these telemetry event sources in line with default or customized status thresholds
The Telemetry Monitoring view has the same functionality as the Integration View therefore refer to:
If you want additional information on Integration health, please review How do I know if my integration is functioning?
2 - Integrations
What is an Integration?
A data source integrated with the SamurAI platform. An integration allows us to collect and ingest telemetry data from multiple sources, including network, endpoint and cloud.
What integrations are available?
We have pre-built integrations to a comprehensive array of 3rd party products and services. Select Supported Integrations to view what is available.
For syslog sources, even if events do not match a supported Integration, we will still ingest events into our data lake as a Generic Log Source. You will still be able to process this data using Advanced Query, and include events from generic log sources within your queries.
How do I integrate data sources?
Select Create for steps to integrate data sources.
Integration Health
Once you have configured Integrations to bring your data into the SamurAI platform, you will also want to make sure that your data sources are healthy. For more details on how to maintain Integration health and troubleshoot problems, please read our article about Integration Health.
What’s Next?
Upon completion of your integrations and validation of health, the platform will start collecting and ingesting telemetry data. Dependent on your phase of MDR onboarding our team will be in contact with you.
2.1 - Supported Integrations
Integrations facilitate the ingestion of data sources from a wide range of third party vendors. Our Integrations are updated regularly as new and emerging technologies are released.
Each Integration typically requires a configuration guide outlining steps you must follow to integrate your data source to the SamurAI platform.
For details such as transport methods and logs collected please refer to each supporting vendor configuration guide by clicking the link in the table or browsing directly to Product Integration Guides.
All supported integrations are categorized according to our Detection Categorization. For further information refer to the following article: Telemetry Data Source Categorization.
Available configuration guides
In the pipeline
Outlined below are integrations we have in the pipeline however have no committed dates for support. Please note any integration may be influenced by changing business opportunities and client requirements. Please contact NTT for further information or if you require additional support.
| Vendor | Product |
|---|---|
| Cloudflare | Cloudflare |
| Palo Alto Networks | Strata Logging Service |
2.2 - Create
Create Integration
- From the SamurAI Portal click Telemetry and select Integrations from the main menu.
- Click Create integration.
- Select the product you wish to integrate with the SamurAI platform.
- Click Next. Dependent on how we collect telemetry, the product may be integrated via a Cloud Collector or Local Collector. Follow the steps based on the Collector type:
Cloud Collector
- If the integration is cloud-based you need to select the relevant Cloud Collector. Select the relevant Cloud Collector and click Next.
- If you are using a public cloud storage account you should already have completed the steps in Cloud Collector.
- If no cloud storage is utilized then a default cloud collector is available.
- Select Configuration Guide which will direct you to SamurAI documentation outlining how to configure your product and obtain required fields.
- Once you have configured your product, complete the required fields.
- Select Finish.
Local Collector
- Your Local Collector(s) will be listed. Select the Local Collector that you will integrate the product with.
- Click Next (typically this is the syslog destination host when configuring your device). If you do not have a Local Collector setup and deployed, follow the steps in our SamurAI Local Collector article.
- The Local Collector IP Address will be displayed, copy the IP address or take note of it.
- Click Configuration Guide which will direct you to SamurAI documentation outlining how to configure your product.
- Based on the product, Extended Data Collection may be displayed, if so jump to Extended Data Collection.
- Click Finish
Extended Data Collection
For many products we are able to collect extended data enhancing our threat detection capabilities and accuracy, for example Packet Capture (PCAP) data. This option will be displayed during configuration of an integration.
- If extended data collection is available for the product, you can choose to enable or disable via the toggle. If you choose to disable, Select Finish
- If you choose to enable extended data collection you must complete all the necessary fields. The parameters for each field are derived from following the associated product configuration guide. Once complete, Select Finish
2.3 - High Availability
If you have products configured in a High Availability configuration e.g. Active/Passive pair you have the option to configure HA Groups.
HA Groups are important for telemetry health monitoring and notifications. An example scenario is if you have an Active/Passive product configuration where the Active node consistently sends data to a local collector, however the Passive node sends intermittent data. In this scenario the Active node status would be reported as OK, however the Passive node status may appear as Critical despite there not being a telemetry ingestion problem.
HA Group telemetry monitoring is handled based on the ‘best’ state of all members e.g in the scenario above if a HA Group has two members and one member has an OK status, and the second member has Critical status the overall group state will be considered OK.
Create HA Group
- Click Telemetry and select Integrations from the main menu
- Click
 (more options) at the top right of the table and select Create HA Group
 - A Create HA Group window will be displayed
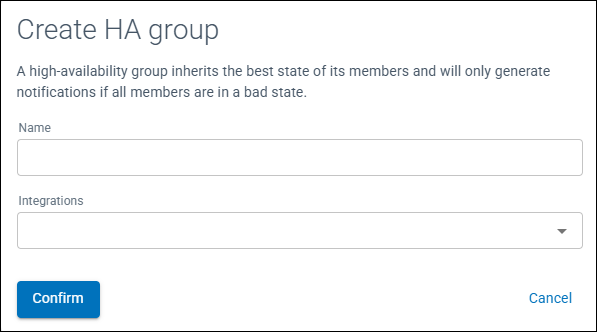
Figure 1: Create HA Group window
- Enter a Name for the HA Group
- From the drop down menu select the integrations to be members of the HA Group
- Click Confirm
Within the Integrations table, the field type HA Group will be displayed with the number of members highlighted.
Edit a HA Group
- Click Telemetry and select Integrations from the main menu
- Click on (more options) to the left of the HA Group and select Edit HA Group
- Add or remove the group members required
- Click Confirm
Delete HA Group
- Click Telemetry and select Integrations from the main menu
- Click on (more options) to the left of the HA Group and select Delete HA Group
- A confirmation window will be displayed, Click Confirm
The HA Group will be deleted and integrations will be listed within the table individually.
HA Group Email Notifications
Email notifications are sent per HA Group and not per individual group member.
At least one member of the HA Group must have notifications enabled, taking into consideration enablement at the Integration or Product level.
Refer to:
2.4 - Details and Status
View Integration
There are multiple methods of viewing your integrations.
To view integrations associated with a specific collector:
- From the SamurAI Portal click Telemetry and select Collectors from the main menu
- Select the relevant Collector
- All integrations associated with the Collector will be displayed with associated information
You can also view all integrations regardless of collector:
- Click Telemetry and select Integrations from the main menu
- An Integrations table will be displayed with all of your Integrations listed
Click on the specific integration to view configuration parameters. You can edit and update a description to help keep track of the integration.
High Availability (HA) Groups
For integrations configured in a HA Group, selecting a HA Group allows you to view the status and details of all members together in a single view.
For integrations of type Log an events graph will be displayed. This is a useful indicator of the number of events over a given period and may show spikes and drops in events.
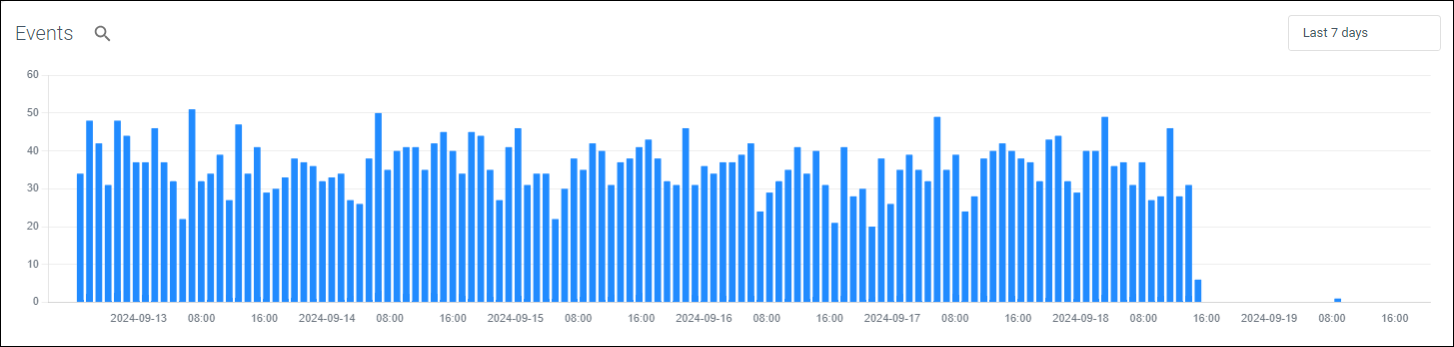
Figure 1: Example events graph
By clicking the time picker you can update the events graph to a specific date and time range. We default to the Last 7 days however have included Quick time ranges.
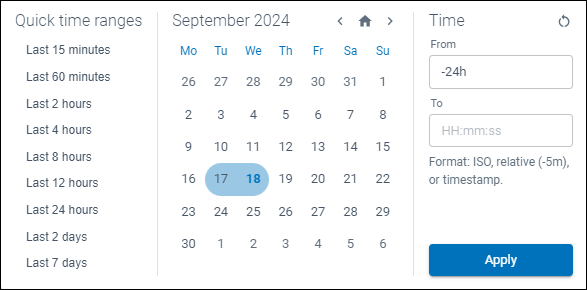
Figure 2: Data and time selector
From the events graph you can pivot directly into Advanced Query by selecting the magnifying glass icon ( ) to view the underlying event data.
Views
You can save filters you set through views. This is useful if, for example, you have a large number of integrations and wish to view only specific products or types of integration.
Click Views to save/reset/delete your different filters. Once saved you can toggle between views.

Figure 3: Views drop down
Integration Status
Potential status displayed are included in the table below:
| Indicator | Status | Description |
|---|---|---|
| Pending | Telemetry components installing / provisioning or awaiting status | |
| Unknown | The SamurAI platform is unable to determine a status or the Vendor/Product are unknown | |
| OK | All components healthy | |
| Warning | Warning status will be displayed if the SamurAI platform has not seen any events per the defined threshold. Refer to Status Thresholds for additional information | |
| Critical | Critical status will be displayed and an email notification will be sent to registered users (by default) if the SamurAI platform has not seen any events per the defined threshold. Refer to Status Thresholds for additional information |
Status Thresholds
The SamurAI platform defines default Warning and Critical thresholds for each integrated product. These thresholds determine when an integration status is reported as Warning or Critical. You can adjust these values per product (e.g for all integrated Palo Alto NG Firewalls) or per integration (e.g for a single Palo Alto NG Firewall). Refer to Custom Thresholds for further information.
To view the default status threshold per product:
- Click on more options (
 ) to the right of the table as depicted:
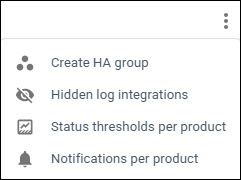
Figure 4: Status thresholds option
- Select Status Thresholds per product
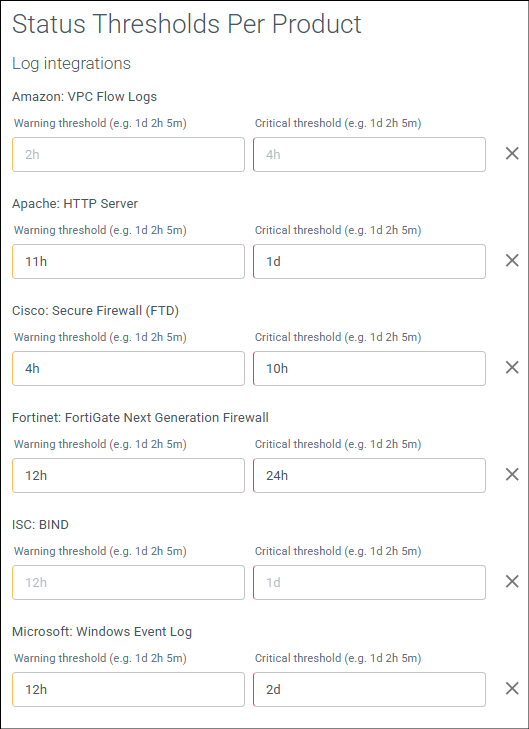
Figure 5: Example default status thresholds per product
Status threshold per product will be displayed, defined in single units or a combination as d (days), h (hours) and m (minutes).
In the example above (Figure 5) for all integrated Cisco: Secure Firewall (FTD) the default thresholds are:
- Warning: 4h. If the SamurAI platform does not receive or ingest any events after 4 hours, the integration status is updated to Warning (displayed within the Integrations Table and the Telemetry Monitoring Table).
- Critical: 10h. If the SamurAI platform does not receive or ingest any events after 10 hours, the integration status is updated to Critical (displayed within the Integrations Table and the Telemetry Monitoring Table, and an email notification is sent to registered users (by default) or as configured by each user.
Custom Thresholds
Custom thresholds can be set per Product (e.g for all integrated Palo Alto NG Firewalls) and/or per Integration (e.g for a single integrated Palo Alto NG Firewall). Set thresholds using a single or combination of time units. Use d for days, h for hours and m for minutes e.g 12h or 1d 2h 10m.
Adjust thresholds per Product
- Click on more options () to the right of the table
- Select Status Thresholds per product
- Enter the Warning threshold in days, hours and/or minutes for the Product
- Enter the Critical threshold in days, hours and/or minutes for the Product
- Click Save
Adjust thresholds per Integration
- Click on more options () to the left of the integration
- Select Status Thresholds
- Enter the Warning threshold in days, hours and/or minutes for the integration
- Enter the Critical threshold in days, hours and/or minutes for the integration
- Click Save
Once saved:
- The integration will display an Info icon (
 )
) - Hovering over the icon will display Custom Status Threshold text with the threshold set per status
Integration Notifications
By default email notifications are enabled. The SamurAI platform sends email notifications to registered users when an integration is reported as Critical e.g. the SamurAI platform has not receieved or ingested any data from the integrated product according to the defined threshold, however this is fully customizable.
Additionally the SamurAI platform will send push notifications if the SamurAI Portal is installed as an app (Progressive Web App - PWA) and notifications are configured within user settings.
Notifications can be set per Product (e.g for all Palo Alto NG Firewalls) and/or per Integration (e.g for a single Palo Alto NG Firewall). Registered users can also customize what notifications they receive. Refer to User Notifications Settings.
Enable or disable notifications per Product
- Click on more options () to the right of the table
- Select Notifications Per Product
- Toggle the setting to enable or disable by selecting the bell icon. Alternatively you can select the default setting
- Click Save

Figure 6: Example notification settings
Enable or disable notification per Integration
- Click on more options () to the left of the integration
- Select Notifications
- A Notifications Settings window will be displayed
- Toggle the setting to enable or disable by selecting the bell icon. Alternatively you can select the default setting
- Click Save
Hide Integration
Hiding an integration will remove it from the integrations displayed and also from the Telemetry Monitoring view and disable notifications.
Only integrations of type Log can be hidden. Some reasons why you may want to hide an integration include:
- You may want to hide all of your unsupported/generic log source integrations.
- And you do not want to receive notifications if there is an issue with telemetry ingestion to the SamurAI platform.
To hide an integration:
- Find the relevant Log integration within the table
- Click on more options () select Hide integration
- A Hide Log Integration window will be displayed, click Confirm
To view any hidden integrations:
- Click on more options () at the top right of the table and select Hidden log integrations
- A Hidden Log Integrations window will be displayed with hidden integrations
Unhide Integration
- Click more options () at the top right of the table and select Hidden log integrations
- A Hidden Log Integrations window will be displayed
- Find the relevant Hidden integration
- Click on more options () to the left of the integration and select Unhide integration
2.5 - Delete
Delete Integration
If you wish to delete an integration associated with a specific Collector:
- From your SamurAI Portal Telemetry and select Collectors from the main menu
- Select the relevant collector from your list
- You will now see all integrations associated with the collector
- Select your integrations
- On the right hand side of the relevant integration, click on
 (more options) and select Delete Integration
 - The following warning will appear: ‘Warning: This is a destructive action and cannot be reversed.’. To ensure you intended to delete the integration you will need to type in the highlighted ‘Integration’s Hostname’ and select Delete Integration
You can also delete from the Integrations menu item:
- Click Telemetry and select Integrations from the main menu
- Find and select your integrated product
- On the right hand side of the relevant integration, click on (more options) and select Delete Integration
2.6 - Generic Log Sources
While we make an effort to support a wide variety of Integrations and different types of log sources, it is possible that there may be a log source that you would like to ingest into the SamurAI platform which we are not able to parse and analyze. This is especially true for events generated via syslog log sources.
The fact that we are not able to use a log source for detections doesn’t mean that it won’t still be useful to ingest into the SamurAI platform. We will ingest any event data, provided via syslog (sent to a SamurAI local collector), into our data lake and you will still be able to analyze that event data using Advanced Query. This allows you to include events from generic log sources when you are performing queries.
If a log source, ingested via syslog, does not match one of our supported integrations, we will ingest the log events, which will still contain, amongst others, the following fields:
- timestamp: the time at which the log message was ingested
- collector: the id of the collector which ingested the event
- host: the source host from which the event was received
- raw: the complete raw log message
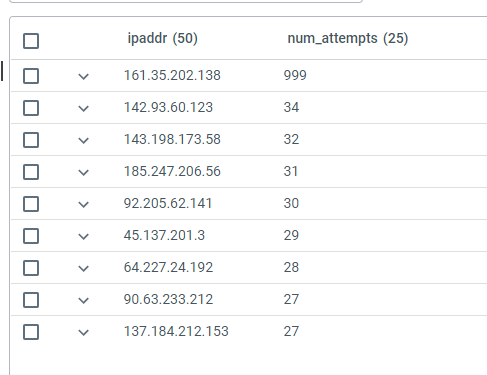
You can then proceed to query these events using Advanced Query. For example, the following KQL query finds all the attempts to connect to a host using invalid user ids and then counts the attempts by source IPv4 or IPv6 address:
events | where host == "10.1.1.1" and i(raw contains "Invalid" or raw contains "failed") and raw !contains "connect" | project timestamp, user = extract("user ([a-zA-Z0-9\\-]+) from ", 1, raw), ipaddr = extract(".+ ([0-9a-f]+[\\:\\.][0-9a-f\\.\\:]+) ", 1, raw) | summarize num_attempts = count() by ipaddr| order by num_attempts
The output is ordered by the number of attempts from each IP address, producing a table like the following:
3 - SamurAI Collectors
What are SamurAI Collectors?
SamurAI Collectors are components used to receive and securely transport telemetry data from client environments, security controls, and cloud services to the SamurAI Platform, where it is ingested for use within the SamurAI MDR service.
Collectors act as ingestion points within the SamurAI Platform, enabling telemetry to be collected from a wide range of technologies and environments.
What do SamurAI Collectors do?
SamurAI Collectors perform the following functions:
- Receive telemetry from security tools, infrastructure, and cloud services
- Support multiple data collection methods depending on the integration
- Securely transmit telemetry to the SamurAI Platform
- Enable consistent ingestion of telemetry across different environments
Collectors act as transport mechanisms, ensuring telemetry is delivered from source systems to the SamurAI Platform for processing and analysis.
Types of SamurAI Collectors
SamurAI MDR uses different types of collectors depending on how telemetry is accessed and integrated.
Local Collector
The Local Collector is deployed within a client-controlled environment and is used to collect telemetry from systems and services that are not directly integrated with the SamurAI Platform.
It is typically used when:
- Telemetry is generated within internal or controlled environments
- A local ingestion point is required to collect and forward telemetry
- Direct integration with the data source is not available
The Local Collector can be deployed on client-managed infrastructure, including virtual environments hosted on-premises or in cloud platforms such as Amazon EC2 and Microsoft Azure.
Cloud Collector
The Cloud Collector is used to collect telemetry from cloud-based services and platforms.
It is typically used when:
- Telemetry is accessed directly from the source using methods such as APIs, cloud storage, or push-based ingestion
- Data is stored in cloud storage or provided by SaaS platforms
- Integration does not require a client-deployed component
The Cloud Collector retrieves or receives telemetry from cloud services and transfers it to the SamurAI Platform.
How are collectors used?
The type of collector required depends on how the telemetry is sourced:
- Local Collector is used when a locally deployed ingestion point is required to collect and forward telemetry
- Cloud Collector is used when telemetry can be accessed directly from cloud services, APIs, or cloud storage
In many cases, the appropriate collector is determined automatically as part of the integration configuration.
How do SamurAI Collectors fit into the platform?
SamurAI Collectors are part of the telemetry ingestion layer within the SamurAI Platform.
- Collectors receive telemetry from source systems
- Data is securely transferred to the SamurAI Platform
- Telemetry is ingested, normalized, and processed for detection and response
This architecture enables consistent telemetry collection across hybrid environments, regardless of where systems are hosted.
Next steps
Review the Supported Integrations and associated Integration Guides to determine the required collector type. Each Integration Guide includes details on whether a Local Collector or Cloud Collector is used, and this is also shown in the SamurAI Portal during integration setup.
You can also work directly in the SamurAI Portal to explore and configure integrations.
To continue and for additional information for each collector type:
3.1 - Local Collector
What is the Local Collector?
The SamurAI Local Collector is a deployable component that enables the collection and secure transfer of telemetry data from client-controlled environments to the SamurAI Platform.
It is used when a local ingestion point is required to collect and forward telemetry from systems that are not directly integrated with the platform.
Multiple Local Collectors can be deployed by a client as necessary to support scaling, segmentation of data sources, or architectural requirements.
What does the Local Collector do?
The Local Collector performs the following functions:
- Receives telemetry from systems within the client environment
- Processes and forwards data to the SamurAI Platform
- Supports multiple ingestion methods, such as syslog and log forwarding mechanisms
- Securely transmits data to the SamurAI Platform
- Buffers data locally during temporary connectivity interruptions
The Local Collector integrates with the broader SamurAI telemetry ingestion architecture, alongside cloud-based and API-driven collection methods.
How does the Local Collector work?
The Local Collector operates as an intermediary between source systems and the SamurAI Platform.
- Telemetry is generated by systems within the client environment
- Data is forwarded to the Local Collector
- The Local Collector receives and prepares the data for ingestion
- Data is securely transmitted to the SamurAI Platform
- The platform processes and analyzes the telemetry
Depending on the integration type, the Local Collector supports both push and pull data collection models.
Where can the Local Collector be deployed?
The Local Collector can be deployed within environments, including:
- On-premises virtual infrastructure (for example VMware vSphere or Microsoft Hyper‑V)
- Cloud-hosted virtual machines (for example Amazon EC2 or Microsoft Azure)
- NTT Smart Data Platform (SDPF)
This flexibility allows the Local Collector to be positioned close to telemetry sources while maintaining secure connectivity to the SamurAI Platform.
What data sources are supported?
The Local Collector can ingest telemetry from a range of systems, including:
- Network infrastructure (for example firewalls and proxies)
- Servers and operating systems
- Identity and authentication systems
- Security tools that generate log-based telemetry
Telemetry is typically forwarded using syslog or supported log forwarding methods.
What is the data flow?
The Local Collector participates in the SamurAI ingestion pipeline as follows:
- Receives telemetry from source systems
- Forwards data securely to the SamurAI Platform
- Data is ingested, normalized, and processed for detection and response
When should the Local Collector be used?
The Local Collector is typically used when:
- Telemetry originates from internal or client-controlled environments
- Systems cannot be integrated directly using API-based methods
- A local ingestion point is required due to network or architectural constraints
Who is responsible for the Local Collector?
The client is responsible for the deployment, installation, and configuration of the Local Collector, including the underlying infrastructure (for example virtual machine, storage, networking, and cloud-hosted environments such as Amazon EC2 or Microsoft Azure).
The client is also responsible for configuring data sources to forward telemetry to the Local Collector and ensuring ongoing connectivity between the Local Collector and the SamurAI Platform.
The SamurAI team is responsible for providing and maintaining the Local Collector software and ensuring its integration with the SamurAI Platform.
The SamurAI platform monitors the health and availability of the Local Collector and will notify registered users if any issues are detected. Once issues are resolved, a notification will confirm the return to a healthy state.
If the SamurAI team identifies that a Local Collector is undersized or under heavy load, we will liaise with the client to determine the appropriate next steps, which may include adjustments to allocated resources or deployment architecture.
What’s Next?
Review the requirements to determine what is needed before deployment and configuration of a Local Collector.
3.1.1 - Requirements
What you need to get started
- Access to the SamurAI Portal and your specific tenant.
- A supported deployment platform for the Local Collector. Supported hypervisors and cloud platforms are listed below.
- A virtual machine that meets the minimum virtual machine requirements.
- The required network changes to meet the Collector connectivity requirements.
- A static IP address for the Collector and DNS server IP addresses, unless you use DHCP.
- Access to the products where you need to make the changes described in the relevant integration guide.
Supported hypervisors
| Hypervisor | Supported version or requirement |
|---|---|
| VMware ESXi | ESXi 8.x and ESXi 9.x |
| Microsoft Hyper-V | Hyper-V 2016 and later; deploy the Local Collector as a Generation 2 virtual machine. |
| Proxmox Virtual Environment | Proxmox VE 8.4.1 and later. |
| KVM-based environments | KVM environments that support UEFI virtual machines and can import the Local Collector KVM bundle. |
Supported cloud platforms
| Platform | Supported instance types or requirements |
|---|---|
| Amazon EC2 | Nitro-based instances using HVM virtualization, Ubuntu Server 22.04 LTS |
| Azure Virtual Machine | Ubuntu Server 22.04 virtual machine that meet the minimum requirements. |
| NTT Smart Data Platform (SDPF) | Ubuntu Server instances that meet the minimum requirements. |
Minimum virtual machine requirements
| Resource | Requirement |
|---|---|
| CPU | 2 vCPU |
| Memory | 4 GB RAM |
Connectivity required for the Collector
The Collector requires connectivity to the resources listed below. Update security controls, such as firewall rules, proxy settings, and DNS configuration, as needed to allow the required communications.
| Function | Protocol | Port | Source | Destination | Details |
|---|---|---|---|---|---|
| Enrolment, Telemetry | TCP | 443 | Collector | *.*.security.ntt nttsecurity.io .nttsecurity.io .*.nttsecurity.io samurai-xdr-prod-westeurope-xgliuoit.azure-api.net | All regular backend communication, telemetry |
| Remote Management | TCP | 443 | Collector | ra.cto.nttsecurity.io deb.releases.teleport.dev apt.releases.teleport.dev | Used for remote administration of Collector (this is not mandatory and used when troubleshooting) |
| NTP | UDP | 123 | Collector | Client infrastructure (NTP server(s)) if configured in SamurAI Portal OR 0.ubuntu.pool.ntp.org 1.ubuntu.pool.ntp.org 2.ubuntu.pool.ntp.org 3.ubuntu.pool.ntp.org | Time synchronization |
| DNS | UDP | 53 | Collector | Client infrastructure (DNS server(s)) or external DNS servers (based on your Collector configuration) | Domain name resolution |
| Ubuntu updates | TCP | 80, 443 | Collector | *.ubuntu.com api.snapcraft.io | Ubuntu software repository |
| Container Management | TCP | 443 | Collector | docker.com *.docker.com (private container registry) docker.io (private container registry) *.docker.io (private container registry) | Private container registry |
| Amazon Cloud dependencies | TCP | 443 | Collector | *.cloudfront.net | Amazon CDN used by Collector API |
| Log storage | TCP | 443 | Collector | *.s3.*.amazonaws.com | Amazon Cloud storage (this is not mandatory and used when troubleshooting) |
| Telemetry data | (based on product - see Integration guide) | Client Product | Collector | Frequent data transfer (based on product) |
What’s next?
You now understand the supported deployment platforms, minimum virtual machine requirements, and required connectivity. Proceed to Deployment.
3.1.2 - Deployment
The need for a Local Collector depends on the product being integrated with the SamurAI platform. This is indicated in the relevant Product Integration Guide.
Create, configure and download a Collector
- Log in to the SamurAI Portal, select Telemetry, and then select Collectors from the main menu.
- Select Create Collector.
- Select Local Collector.
- Complete the fields as required.
| Field | Description |
|---|---|
| Collector name | A nickname for the Collector. |
| Description (Optional) | A description of the Collector, such as the property name where it is installed. |
| Location (Optional) | Useful when you have Collectors in multiple locations. |
| Hostname | A hostname for the Collector. |
| Proxy Server IP (Optional) | An optional HTTP proxy URL containing a hostname or IP address and port, for example https://192.168.1.254:8080. |
| NTP Servers (Optional) | Your NTP server IP addresses. |
| DHCP or Static | Select DHCP, or specify a static IP address and network information. |
- Select Create Collector.
- Select the Collector by clicking the name provided in step 4.
- Select Download.
The files you download depend on the deployment platform.
Configuration
- ISO — Collector-specific configuration file.
- Required for all virtual-machine deployments. Mount this ISO when the Collector starts for the first time so that it can configure and register with the SamurAI platform.
Cloud init
- AWS — Cloud-init data for an AWS instance.
- Azure — Cloud-init data for an Azure virtual machine.
- SDPF — Cloud-init data for an NTT Smart Data Platform (SDPF) instance.
Virtual machine
- OVA — Virtual appliance package for VMware vSphere and Proxmox VE.
- Includes the virtual disk image and virtual-machine configuration.
- VMDK — Virtual disk image for VMware vSphere.
- For manual deployment; it requires manual virtual-machine configuration.
- VHDX — Virtual hard-disk image for Microsoft Hyper-V.
- KVM bundle — Virtual-machine package for KVM-based environments.
- The bundle contains the files required to deploy the Local Collector on a KVM platform.
- OVA — Virtual appliance package for VMware vSphere and Proxmox VE.
- Download the Collector configuration ISO file and the file required for your selected deployment platform.
Install a Collector
Select the section relevant to your deployment platform:
- VMware vSphere
- Microsoft Hyper-V
- Proxmox VE
- KVM-based environments
- Amazon EC2
- Azure Virtual Machine
- NTT Smart Data Platform (SDPF)
VMware vSphere
Follow the VMware documentation:
- When prompted for a virtual-machine name, use a meaningful name, for example
samurai-nttsh-collector. - Select the Local Collector OVA file downloaded from the SamurAI Portal.
- Ensure the virtual machine is configured to use UEFI firmware.
- Configure CPU, memory, storage, and networking in accordance with the Minimum Virtual Machine Requirements.
After deployment, configure the virtual machine to use the Local Collector configuration ISO file. Refer to VMware documentation:
- Select the Collector configuration ISO file downloaded from the SamurAI Portal when prompted to select an ISO file.
- Ensure that the CD/DVD drive is connected when the virtual machine starts.
- Power on the virtual machine.
Microsoft Hyper-V
Follow Microsoft documentation:
- When prompted for a virtual-machine name, use a meaningful name, for example
samurai-nttsh-collector. - Configure the virtual machine to use UEFI firmware.
- Configure memory and networking in accordance with the Minimum Virtual Machine Requirements.
- When prompted to connect a virtual hard disk, select the VHDX file downloaded from the SamurAI Portal.
- Attach the Collector configuration ISO file to the virtual DVD drive and ensure that the drive is connected at startup.
- Start the virtual machine.
Proxmox Virtual Environment
Follow the Proxmox documentation:
- Create or select storage to use as the import source.
- Use the OVA/OVF import workflow to import the Local Collector OVA file downloaded from the SamurAI Portal.
- Ensure that the imported virtual machine is configured to use UEFI firmware.
- Configure CPU, memory, storage, and networking in accordance with the Minimum Virtual Machine Requirements.
Import the Local Collector configuration ISO file to Proxmox:
- Navigate to Datacenter and select Storage.
- Select the storage location where you want to store the ISO file.
- Select ISO Images.

- Select Upload.
- Select the Local Collector configuration ISO file and upload it using the default settings.

Configure the Local Collector virtual machine to use the configuration ISO file:
- Select the Local Collector virtual machine, select Hardware, and then select Add.

- Select CD/DVD Drive.

- Select Use CD/DVD disk image file (ISO), locate the Local Collector configuration ISO file, and then select Add.

- Confirm that the network interface is available as Network Device (net0).
- Start the virtual machine.
KVM-based environments
This section applies to KVM environments, including platforms that use libvirt, QEMU/KVM, or another KVM management interface. Because KVM implementations and management interfaces differ, follow the documentation provided by your KVM platform for the virtual-machine creation and import workflow.
Prerequisites:
- Download the Collector configuration ISO file for the Collector you created.
- Download the Local Collector KVM bundle from the SamurAI Portal.
- Extract the KVM bundle.
Use your KVM platform documentation to create or import a virtual machine using the extracted Local Collector image.
When creating or configuring the Local Collector virtual machine:
- Configure the virtual machine to use UEFI firmware.
- Configure CPU, memory, storage, and networking in accordance with the Minimum Virtual Machine Requirements.
- Attach the Local Collector configuration ISO file as a virtual CD/DVD drive.
- Ensure the virtual CD/DVD drive is connected when the virtual machine starts for the first time.
- Start the virtual machine.
For guidance on KVM virtual-machine configuration, refer to the documentation for your management platform. Examples include:
Amazon EC2
Prerequisite steps:
- Download the AWS
cloud-init.yamlfile from Create, configure and download a Collector. You will use this file during EC2 instance deployment.
Follow Amazon documentation to launch an EC2 instance:
Apply the following adjustments while following the Amazon documentation:
- Select Ubuntu Server 22.04 LTS AMI.
- Select the latest supported Ubuntu AMI.
- Select an instance type that meets the Minimum Virtual Machine Requirements.
- Configure the key pair and network settings according to your organisation’s policies. Ensure network settings fulfil the Connectivity required for the Collector.
- In Configure storage:
- Set the root volume to at least 64 GiB.
- Add a secondary volume of at least 500 GiB, sized in accordance with the Minimum Virtual Machine Requirements.
- In Advanced details, paste the contents of the AWS
cloud-init.yamlfile into User data. Do not select User data has already been base64 encoded. - Complete the remaining instance configuration according to your organisation’s requirements and the Amazon documentation.
Azure Virtual Machine
Prerequisite steps:
- Download the Azure
cloud-init.yamlfile from Create, configure and download a Collector. You will use this file during Azure virtual-machine deployment.
Follow Microsoft documentation to create an Azure virtual machine:
Apply the following adjustments while following the Microsoft documentation:
- Under the Basics tab, select Ubuntu Server 22.04 LTS as the image.
- Under the Basics tab, select a suitable size that meets the Minimum Virtual Machine Requirements.
- Under the Disks tab, add one data disk of at least 500 GiB, sized in accordance with the Minimum Virtual Machine Requirements.
- Under the Advanced tab, paste the contents of
cloud-init.yamlinto the Custom data field.
NTT Smart Data Platform (SDPF)
Prerequisite steps:
- Download the SDPF
cloud-init.yamlfile from Create, configure and download a Collector. You will use this file during instance creation.
Follow NTT documentation to create a server instance:
Apply the following adjustments while following the NTT documentation:
- When selecting the image, select the latest Ubuntu 24.04 official image.
- When selecting compute series and size, select a suitable specification that meets the Minimum Virtual Machine Requirements.
- Add a separate data disk of at least 500 GB, sized in accordance with the Minimum Virtual Machine Requirements.
- When selecting the logical network, ensure that it fulfils the Connectivity required for the Collector. This typically requires an Internet Gateway, logical network, subnet, and potentially firewall rules that allow the Collector’s required outbound connectivity.
- In the Post-install script field, select Direct Input and paste the contents of the
cloud-init.yamlfile.
Deleting a Collector
To delete a Local Collector:
- In the SamurAI Portal, select Telemetry and then Collectors.
- Select the relevant Collector.
- On the right side of the relevant Collector, select More Options (
 ) and then select Delete Collector.
 - Review the warning. To confirm the destructive action, enter
DELETEand select Delete Collector.
Replacing a Collector
If a Local Collector virtual machine is lost because of corruption or damage, such as a major storage failure, delete the existing Collector in the SamurAI Portal, discard the old virtual-machine image, and create a new Collector by following the installation process.
- To replace a Local Collector VM, you cannot download the installer ISO for an existing Collector and redeploy it. Delete the old Collector and create a replacement Collector.
- You can reuse the same IP address as the old Collector. This allows replacement without reconfiguring log sources that sent logs to the original Collector.
- Integrations that were automatically detected and attached to the original Collector are automatically detected and attached to the replacement Collector.
- Add again any integrations that were manually added to the original Collector.
What’s next?
You have now deployed and configured your Local Collector.
Refer to Local Collector Details for information about validating Collector status and additional configuration.
3.1.3 - Local Collector Details
Validate Collector Status
Click Telemetry and select Collectors from the main menu
Select the relevant Collector from the presented list
View Status
| Indicator | Status | Description |
|---|---|---|
| Pending | Collector components installing / provisioning or awaiting status | |
| Unknown | The SamurAI platform is unable to determine a status | |
| OK | Healthy | |
| Warning | Warning status will be displayed if the Collector is experiencing any issues e.g components are experiencing problems | |
| Critical | Critical status will be displayed and an email notification will be sent to registered users (by default) if the SamurAI platform cannot communicate with the Collector |
After you provision a Collector VM and start it, it will go through a process of installing updates and modules specified in the configuration ISO file which you downloaded. The time taken for this process is dependent on factors like the speed of the hardware you are running the Collector on and connectivity to the repositories that it downloads updates from. In some cases this process can take around 30 minutes.
If you have any problems, please submit a ticket via the SamurAI Portal.
Collector Email Notifications
By default email notifications are enabled. The SamurAI platform sends email notifications to registered users when a Collector is reported as Critical (e.g. the SamurAI platform cannot communicate to the Collector) however this is customizable by users for any Collector status.
Enable or Disable Email Notifications
- Click on More Options () to the right of the table
- Select Notifications
- Toggle the setting to enable or disable by selecting the bell icon. Alternatively you can select the default setting
- Click Save
You can also achieve this per individual Collector by:
- Click on More Options () to the left of the Collector
- Select Notifications
- Toggle the setting to enable or disable by selecting the bell icon. Alternatively you can select the default setting (send notification).
- Click Save
What’s next?
The next step is to start configuring integrations which will allow the SamurAI platform to start receiving your telemetry data.
Select Integrations Overview for more information on integrations and where to start.
If you require high availability for your collector, this can be achieved using the capabilities of your virtualization platform.
3.2 - Cloud Collector
What is a Cloud Collector?
The SamurAI Cloud Collector enables the collection and secure transfer of telemetry data from cloud-based services and platforms to the SamurAI Platform.
It is used when telemetry can be accessed directly from the source without requiring a locally deployed component.
The Cloud Collector is a platform-managed component that integrates with supported services to retrieve or receive telemetry data.
Multiple Cloud Collectors may be used as part of a deployment, depending on the integration design and architecture.
What does the Cloud Collector do?
The Cloud Collector performs the following functions:
- Retrieves or receives telemetry from cloud-based services and platforms
- Supports multiple integration methods depending on the data source
- Securely transfers telemetry to the SamurAI Platform
- Enables ingestion of telemetry without requiring client-managed infrastructure
The Cloud Collector operates as part of the SamurAI telemetry ingestion architecture, alongside Local Collectors.
How does the Cloud Collector work?
The Cloud Collector integrates directly with supported services to access telemetry data.
- Telemetry is generated by cloud services or external platforms
- The Cloud Collector receives or retrieves telemetry using the appropriate integration method
- Data is securely transferred to the SamurAI Platform
- The platform ingests, processes, and analyzes the telemetry
Depending on the integration type, the Cloud Collector supports both push and pull data collection models.
How is telemetry accessed?
The Cloud Collector supports multiple integration methods depending on the source system:
- API-based collection – telemetry is retrieved directly from service APIs (for example SaaS or cloud security platforms)
- Cloud storage ingestion – telemetry is read from cloud storage (for example AWS S3 or Azure Blob Storage)
- Push-based ingestion – telemetry is sent directly to the platform over HTTP (for example Splunk HTTP Event Collector)
The method used is determined by the supported integration and data source.
Where is the Cloud Collector deployed?
The Cloud Collector is a platform-managed component. It does not require software to be deployed on client-managed infrastructure.
Where a cloud provider deployment is required for a supported integration, deployment-specific configuration and provisioning steps are described in the relevant Deployment guide.
It integrates directly with supported services to access telemetry data.
When should the Cloud Collector be used?
The Cloud Collector is typically used when:
- Telemetry is available from cloud-based services or SaaS platforms
- Data can be accessed directly via APIs, cloud storage, or push-based ingestion
- No local ingestion point is required
Who is responsible for the Cloud Collector
The Cloud Collector is managed as part of the SamurAI Platform and does not require deployment or maintenance within the client environment.
The SamurAI team is responsible for the operation, health, and availability of the Cloud Collector.
The SamurAI platform monitors the status of the Cloud Collector and will notify registered users if any issues are detected. Once issues are resolved, a notification will confirm when a healthy state has been restored.
The client is responsible for configuring each integration and ensuring that required data sources remain accessible. This includes setting up and maintaining the required credentials, permissions, connection details, and cloud-provider configuration described in the relevant Integration and Deployment Guides.
The client is also responsible for reviewing Collector status and responding to configuration issues that prevent telemetry from being collected or accessed.
What’s next?
Review Deployment to understand how to create and deploy a Cloud Collector.
3.2.1 - Deployment
The need for a Cloud Collector is based on the specific product being integrated with the SamurAI platform. This will be clearly indicated within the Product Integration Guide.
Create a Cloud Collector
From the SamurAI Portal, click Telemetry and select Collectors from the main menu
Select Create Collector
Select Cloud collector
Complete the fields as required.
| Field | Description |
|---|---|
| Collector name | A name for the collector |
| Description (Optional) | A description of your collector |
| Provider | Select the correct Provider |
Select Create Collector
Follow the relevant section below based on your provider:
Microsoft Azure
- Click Deploy to Azure and you will be redirected to the Microsoft Azure login.
- An Azure Resource Manager (ARM) template will be launched, follow the steps and complete the necessary fields within the template:
Project Details
| Field | Description |
|---|---|
| Subscription | Select your Azure subscription |
| Resource Group | Create or select your Resource Group |
Instance Details
| Field | Description |
|---|---|
| Region | Select the Azure region to deploy the Collector into |
| Collector Name | (this is auto populated from the SamurAI Portal Collector name you defined) |
| Collector Id | (this is auto populated from SamurAI) |
| Passkey | (this is auto populated from SamurAI) |
| Data Retention Days | The amount of days to keep the data in the container (default is 7 days) |
| Storage Account Name | The name of the Storage Account (a default is auto populated) |
| Event Grid Topic Name | The name of the Event Grid Topic (a default is auto populated) |
| Deployment Script Name | The name of the Deployment Script used for auto registration (a default is auto populated) |
| Endpoint | SamuraAI Endpoint (Do not modify) |
Select Next
Select Review and Create
Upon creation your Collector status will be updated to Healthy.
You can now refer to the relevant Product Integration Guides.
Amazon Web Services (AWS)
- Click Launch Stack and you will be redirected to the AWS login.
Login to your AWS account with administrative permissions.
The SamurAI cloud formation template will be displayed.
If you have an existing S3 Bucket enter the name within the Parameters section under Enable SamurAI ingestion on existing S3 bucket. If you have no existing S3 bucket, leave this field blank and a new S3 bucket will be created.
If you are integrating Cisco Umbrella, be sure to update Cisco Umbrella under the Parameters section to Yes.
Click Create Stack.
Upon creation of the stack your Collector status will be updated to Healthy.
You can now refer to the relevant Product Integration Guides.
Additional required steps when using an existing bucket
- Add the following to the bucket policy, please update the json with the correct bucket name.
 {
    "Effect": "Allow",
    "Principal": {
        "AWS": "arn:aws:iam::600502389717:user/samurai-xdr-s3-reader-user"
    },
    "Action": [
        "s3:GetObject",
        "s3:ListBucket"
    ],
    "Resource": [
        "arn:aws:s3:::BUCKET_NAME",
        "arn:aws:s3:::BUCKET_NAME/*"
    ]
}
Create an Event Notification in the bucket properties.
Enter an Event Name for the notification, leave the Prefix and Suffix boxes blank.
Select All object create events
Under Destination, select SNS Topic and select the SNS topic that was created by the Cloud Formation Template from the drop down and click Save Changes.
Splunk HTTP Event Collector
- If you selected this option you will be presented with the following information:
- API URL
- Token
Copy these entries as you will need them when completing your integration.
- Select Close.
Deleting a Collector
If you need to delete a Cloud collector you can do so by following the steps below:
- From your SamurAI Portal click Telemetry and select Collectors from the main menu
- Select the relevant collector from your list
- On the right hand side of the relevant collector, click on More Options () and select Delete Collector
- The following warning will appear: ‘Warning: This is a destructive action and cannot be reversed.’. To ensure you intended to delete the collector you will need to type DELETE in the window and select Delete Collector
What’s next?
You should now have a Cloud Collector running.
Refer to Cloud Collector Details for information on validating Collector Status and details.
3.2.2 - Cloud Collector Details
Validate Collector Status
Select Telemetry and Collectors from the main menu
Select the relevant Collector from the presented list
View Status
| Indicator | Status | Description |
|---|---|---|
| Pending | Collector components installing / provisioning or awaiting status | |
| Unknown | The SamurAI platform is unable to determine a status | |
| OK | Healthy | |
| Warning | Warning status will be displayed if the Collector is experiencing any issues e.g components are experiencing problems | |
| Critical | Critical status will be displayed and an email notification will be sent to registered users (by default) if the SamurAI platform cannot communicate with the Collector |
Collector Email Notifications
By default email notifications are enabled. The SamurAI platform sends email notifications to registered users when a Collector is reported as Critical (e.g. the SamurAI platform cannot communicate to the Collector) however this is customizable by users for any Collector status.
Enable or Disable Email Notifications
- Click on More Options () to the right of the table
- Select Notifications
- Toggle the setting to enable or disable by selecting the bell icon. Alternatively you can select the default setting
- Click Save
You can also achieve this per individual Collector by:
- Click on More Options () to the left of the Collector
- Select Notifications
- Toggle the setting to enable or disable by selecting the bell icon. Alternatively you can select the default setting (send notification).
- Click Save
What’s next?
The next step is to start configuring integrations which will allow the SamurAI platform to collect your telemetry data.
Select Integrations Overview for more information on integrations and where to start.
4 - Network Traffic Analyzer (NTA)
What is the NTA?
The SamurAI Network Traffic Analyzer (NTA) is a virtual appliance designed to provide deep visibility into network activity and detect suspicious or malicious behaviour. It can be deployed in a virtual environment or as an AWS EC2 instance, enabling passive monitoring and analysis of east-west and north-south traffic for security threats and anomalies. The NTA compliments existing security measures, delivering deeper insight into traffic and potential risks. Our approach leverages core capabilities to maximize protection and visibility:
Advanced Analytics
- Utilizing machine learning and behavioral analysis, the SamurAI Real-Time Engine (deployed on the NTA) identifies anomalous network activities that could indicate security threats, even those that evade traditional detection methods.
Cyber Threat Intelligence Integration
- We apply our global threat intelligence feeds to enrich network data with context about known malicious actors, emerging threats, and attack patterns. This enhances the accuracy and speed of threat detection.
Network Layer Threat Hunting
- The ability to proactively hunt for threats at the network layer, our SamurAI SOC analysts can identify suspicious patterns and indicators of compromise that automated systems might miss.
Full Packet Capture (PCAP)
- With full packet capture capabilities, the SamurAI NTA allows for comprehensive forensic analysis. In the event of a security incident, SamurAI SOC analysts can reconstruct sessions and examine payloads to understand the full scope and impact of the breach.
What are example use cases for the NTA
- Clients with bespoke or unsupported systems e.g no current integration
- Clients who want to expand their monitoring capabilities leveraging NTTs global threat intelligence
- Clients who want to expand monitoring beyond telemetry data sources integrated into SamurAI MDR, or have systems that do not produce telemetry data with limited threat detection capabilities, refer to Telemetry Data Source Categorization to understand how SamurAI categorizes supported integrations
- Clients who wants to get a quick cyber security grip on new acquisitions
- Clients with distributed branch offices with heterogenous environments and no central log collection
What are the components of the NTA?
The NTA gains visibility of network traffic through traffic mirroring. The NTA monitors the traffic utilizing specific components and generates security detections (alerts) which are sent to the SamurAI platform and triaged, investigated and validated by SOC analysts potentially leading to a security incident reported to you. Refer to the high level diagram below:

Figure 1: The NTA internal components
Traditional IDS Meets Advanced Analytics
- The NTA includes a traditional Intrusion Detection System (IDS) component (Suricata), which provides baseline network monitoring. However, its true strength lies in its ability to decode network protocols, converting them into detailed activity logs.
Real-Time Detection with Advanced Analytics
- These activity logs are processed by the NTA resident SamurAI Real-Time Engine, which applies:
- Advanced Analytics to identify subtle anomalies.
- Threat Intelligence to detect known malicious patterns.
- This approach ensures a proactive, accurate understanding of network activity.
Full Traffic Recording (Stenographer)
- The NTA records all traffic flowing through its sensor.
- This enables comprehensive forensics and retrospective analysis, providing critical insights into historical activity.
Automatic Alert Data Collection
- When an alert is triggered, the NTA automatically captures related packet data and sends it upstream to the SamurAI platform for investigation by SOC Analysts.
- This allows for immediate analysis and a deeper understanding of a potential incident.
What data is analyzed by the NTA?
All network traffic you decide to mirror to the NTA is analyzed. The NTA operates passively monitoring the mirrored traffic without introducing latency or affecting production systems. Even when network traffic is encrypted (e.g HTTPS, SSL/TLS), the NTA can still extract and analyze unencrypted meta data such as IP addresses, port numbers, traffic patterns and correlate this metadata with Threat Intelligence such as known malicious IPs, domains or abnormal behaviors - the NTA can identify potential threats and suspicious activity maintaining effective threat detection without decrypting the payload.
If a client has the capability to decrypt traffic before mirroring to the NTA it is of course advantageous, however we recognize this may not be optimal or available in many cases.
All data resides local to the NTA. Any security detections (alerts) made by the NTA coupled with PCAP data is sent to the SamurAI platform for investigation by SOC Analysts.
What are the deployment options?
There are two options for deploying the SamurAI NTA, both options cover network traffic visibility but are deployed and configured differently.
Who is responsible for the NTA?
You, the client is responsible for installation and configuration of the NTA including the underlying hypervisor/virtual machine settings and/or AWS EC2 configuration and settings.
The SamurAI team is responsible for ensuring health and availability of the NTA which includes maintenance of the Operating System and installed software.
SamurAI will send email notifications to registered users should your NTA encounter any problems, once any issues have been resolved you will be notified again when a healthy status is reached.
If the SamurAI team determines that an NTA is oversubscribed we will liaise with you to determine the best plan forward - this could include requesting you to update assigned virtual resources.
Can I get assistance with deployment of an NTA
Yes, if you require help and guidance with NTA deployment and configuration we can help via the SamurAI Onboarding service. The service is typically utilized by new SamurAI MDR clients to support transition onto SamurAI Managed Detection and Response (MDR) but also for clients who wish to expand or review existing commitment including the NTA.
What’s Next?
Review the requirements to determine what is needed before deployment and configuration of an NTA.
4.1 - Requirements
What you need to get started
- Access to the SamurAI Portal and your specific tenant.
- A supported deployment platform for the NTA. Supported hypervisors and cloud platforms are listed below.
- An NTA virtual machine that meets the recommended specifications for the required monitoring throughput.
- Network changes required to meet the NTA communication requirements.
- A static IP address for the NTA management interface and DNS server IP addresses, unless you use DHCP.
- Access to configure traffic mirroring to the NTA monitoring interface.
Supported hypervisors
| Hypervisor | Supported version or requirement |
|---|---|
| VMware ESXi | ESXi 8.x and ESXi 9.x |
| Microsoft Hyper-V | Hyper-V 2016 and later; deploy the NTA as a Generation 2 virtual machine. |
| Proxmox Virtual Environment | Proxmox VE 8.4.1 and later. |
| KVM-based environments | KVM environments that support UEFI virtual machines, provide two virtual network interfaces, and can import the NTA KVM bundle. |
Supported cloud platforms
| Platform | Supported instance types or requirements |
|---|---|
| Amazon EC2 | Nitro-based instances using HVM virtualization and supporting VPC Traffic Mirroring. |
Amazon Web Services support
For AWS deployment, the NTA requires AWS Nitro instances that support traffic mirroring. For more information, refer to:
Recommended specifications
NTA sizing is based on the expected monitored network throughput. Select the NTA size that meets your required throughput.
| Medium | Large | |
|---|---|---|
| Throughput | 500 Mbit/s | 1000 Mbits/s |
| CPU | 8 Cores | 8 cores |
| Memory | 52 GB RAM (32 GB RAM for OS and 20GB RAM for ramdisk) | 104 GB RAM (64 GB RAM for OS and 40GB RAM for ramdisk) |
| Disks | System disk: 300GB Data disk 200GB | System disk: 300GB Data disk 200GB |
| Network Interfaces | Management:1 x 1 Gbit/s Network Monitoring:1 x 1 Gbit/s | Management:1 x 1 Gbit/s Network Monitoring:1 x 1 Gbit/s |
Communication requirements
The NTA requires connectivity to the resources listed below. Update security controls, such as firewall rules, proxy settings, and DNS configuration, as needed to allow the required communications.
| Function | Protocol | Port | Source | Destination | Details |
|---|---|---|---|---|---|
| Enrolment, NTA backend | TCP | 443 | NTA | *.*.security.ntt nttsecurity.io .nttsecurity.io .*.nttsecurity.io samurai-xdr-prod-westeurope-xgliuoit.azure-api.net | All regular backend communication |
| Remote Management | TCP | 443 | NTA | ra.cto.nttsecurity.io deb.releases.teleport.dev apt.releases.teleport.dev | Remote administration of an NTA |
| NTP | UDP | 123 | NTA | Client infrastructure (NTP server(s)) if configured in SamurAI Portal OR 0.ubuntu.pool.ntp.org 1.ubuntu.pool.ntp.org 2.ubuntu.pool.ntp.org 3.ubuntu.pool.ntp.org | Time synchronization |
| DNS | UDP | 53 | NTA | Client infrastructure (DNS server(s)) or external DNS servers (based on your NTA configuration) | Domain name resolution |
| Ubuntu updates | TCP | 80, 443 | NTA | *.ubuntu.com api.snapcraft.io | Ubuntu software repository |
| Container Management | TCP | 443 | NTA | docker.com *.docker.com (private container registry) docker.io (private container registry) *.docker.io (private container registry) | Private container registry |
| Amazon Cloud dependencies | TCP | 443 | NTA | *.cloudfront.net | Amazon CDN used by NTA API |
What’s next?
You now understand the supported deployment platforms, NTA sizing requirements, and required communications. Proceed to SamurAI NTA Deployment.
4.2 - Deployment
Deployment considerations
Traffic source
The NTA is a passive device. It relies on customer infrastructure to send a copy of network traffic to the NTA monitoring interface. When deploying an NTA in a virtual environment or on Amazon EC2, consider the following requirements to achieve effective traffic monitoring and minimise performance impact.
Resource allocation
Ensure the NTA meets the recommended specifications. In some circumstances, the allocated resources may not be sufficient. We may recommend changes after the NTA is deployed and traffic throughput has been assessed.
Multi-NTA deployments
If expected network throughput exceeds the capacity of one NTA, deploy multiple NTAs to maintain coverage.
Network topology and segmentation
Map the virtual network topology and identify the optimal deployment location for the NTA. Consider both:
- East-west traffic between workloads on the same virtual switch, virtual network, or Amazon VPC.
- North-south traffic between internal and external networks, such as internet-facing web traffic.
Traffic visibility
A copy of monitored traffic must be sent to the NTA monitoring interface.
Recommended traffic sources include:
- Client-to-internet traffic.
- Client-to-client traffic.
- Client-to-server traffic.
Traffic that is typically not useful for NTA monitoring includes:
- High-volume encrypted traffic where the NTA cannot inspect the payload.
- SAN and backup traffic.
Capture traffic by configuring network mirroring or traffic monitoring for the selected deployment platform.
Virtual environments
Network mirroring on a virtual switch copies traffic from one or more source ports to a destination mirror port. Connect that destination to the NTA monitoring interface. In virtualised environments, the implementation may use port mirroring, SPAN, promiscuous mode, or a platform-specific monitoring capability.

Figure 1: The NTA in a virtual environment
Amazon EC2
For Amazon EC2 deployments, use VPC Traffic Mirroring to copy traffic from an Elastic Network Interface (ENI) to the NTA monitoring interface.

Figure 2: The NTA running on AWS
Create, configure and download an NTA
- Log in to the SamurAI Portal, select Telemetry, and then select Network Traffic Analyzer from the main menu.
- Select Create.
- Complete the fields as required.
| Field | Description |
|---|---|
| NTA name | A name for the NTA. |
| Description (Optional) | A description of the NTA. |
| Location (Optional) | Useful when you have NTAs in multiple locations. |
| Hostname | A hostname for the NTA. |
| Proxy Server address (Optional) | An optional HTTP proxy URL containing a hostname or IP address and port, for example https://192.168.1.254:8080. |
| NTP Servers (Optional) | Your NTP server IP addresses. |
| Size | Select the appropriate size based on expected monitored throughput. |
| DHCP or Static | Select DHCP, or specify a static IP address and network information. |
- Select Create NTA after completing the relevant fields.
- Select the NTA by clicking the NTA Name used in step 3.
- Select Download.
The files you download depend on the selected deployment platform.
Configuration
- ISO — NTA-specific configuration file.
- Required for all NTA deployments. Mount this ISO when the NTA starts for the first time so that it can configure and register with the SamurAI platform.
- ISO — NTA-specific configuration file.
Cloud init
- AWS — Cloud-init data for an Amazon EC2 instance.
Virtual machine
- **OVA - Virtual appliance package for VMware vSphere and Proxmox VE (includes disk images)
- VMDK — Virtual disk image for VMware vSphere manual deployment (not needed if using the OVA).
- VHDX — Virtual hard-disk image for Microsoft Hyper-V.
- **KVM bundle — — Virtual-machine package for KVM-based environments
- Download the NTA configuration ISO file and the file or files required for the selected deployment platform.
NTA installation
Select the section relevant to your deployment platform:
VMware vSphere installation
Follow the VMware documentation:
- Provide a meaningful virtual-machine name.
- Select the NTA OVA file downloaded from the SamurAI Portal. Select the appropriate E1000 or E500 variant for the target environment.
- Ensure the virtual machine is configured to use UEFI firmware.
- Configure CPU, memory, storage, and both virtual network interfaces in accordance with the recommended specifications.
After deployment, mount the NTA configuration ISO file. Refer to VMware documentation:
- Select the NTA configuration ISO file downloaded from the SamurAI Portal.
- Ensure the CD/DVD drive is connected when the virtual machine starts.
- Confirm that Network Device (net0) is connected to the management network.
- Confirm that Network Device (net1) is connected to the network or port group that receives mirrored traffic.
- Start the virtual machine.
- Continue to Deployment status.
Proxmox VE installation
Follow the Proxmox documentation:
- Create or select storage to use as the import source.
- Use the OVA/OVF import workflow to import the NTA OVA file downloaded from the SamurAI Portal. Select the appropriate E1000 or E500 variant for the target environment.
- Ensure the imported virtual machine is configured to use UEFI firmware.
- Configure CPU, memory, storage, and both virtual network interfaces in accordance with the recommended specifications.
Import the NTA configuration ISO file to Proxmox:
- Navigate to Datacenter and select Storage.
- Select the storage location where you want to store the ISO file.
- Select ISO Images.
- Select Upload.
- Select the NTA configuration ISO file and upload it using the default settings.
Configure the NTA virtual machine to use the configuration ISO file:
- Select the NTA virtual machine, select Hardware, and then select Add.
- Select CD/DVD Drive.
- Select Use CD/DVD disk image file (ISO), locate the NTA configuration ISO file, and select Add.
- Confirm that Network Device (net0) is connected to the management network.
- Confirm that Network Device (net1) is connected to the network or bridge that receives mirrored traffic.
- Start the virtual machine.
- Continue to Deployment status.
Microsoft Hyper-V installation
Follow Microsoft documentation:
- Provide a meaningful virtual-machine name.
- Create the NTA as a Generation 2 virtual machine.
- Configure CPU, memory, storage, and two virtual network adapters in accordance with the recommended specifications.
- When prompted to connect a virtual hard disk, select the NTA VHDX file downloaded from the SamurAI Portal.
- Attach the NTA configuration ISO file to the virtual DVD drive and ensure the drive is connected at startup.
- Connect Eth0 to the management network.
- Connect Eth1 to the virtual switch or network that receives mirrored traffic.
- Start the virtual machine.
- Continue to Deployment status.
KVM-based environments installation
This section applies to KVM environments, including platforms that use libvirt, QEMU/KVM, Open vSwitch, or another KVM management interface. The exact workflow for creating or importing a virtual machine and configuring traffic mirroring differs by KVM management platform. Follow your platform’s documentation for these actions.
Prerequisites:
- Download the NTA configuration ISO file for the NTA you created.
- Download the NTA KVM bundle.
- Extract the KVM bundle.
Use your KVM platform documentation to create or import a virtual machine from the extracted NTA image.
When creating or configuring the NTA virtual machine:
- Configure the virtual machine to use UEFI firmware.
- Configure CPU, memory, system disk, and data disk in accordance with the recommended specifications.
- Add two virtual network interfaces.
- Connect the first interface to the management network, which must allow the required outbound connectivity.
- Connect the second interface to a dedicated monitoring network, virtual switch, bridge, or port that receives mirrored traffic.
- Attach the NTA configuration ISO file as a virtual CD/DVD drive.
- Ensure the virtual CD/DVD drive is connected when the virtual machine starts for the first time.
- Start the virtual machine.
- Continue to Deployment status.
Refer to the documentation appropriate for your KVM environment:
- libvirt domain XML format
- Red Hat Enterprise Linux: Managing virtual devices
- Open vSwitch: Basic configuration and port mirroring
Amazon EC2 installation
Prerequisites:
- Download the AWS
cloud-init.yamlfile from Create, configure and download an NTA. You will use this file during EC2 instance deployment.
Follow Amazon documentation to launch an EC2 instance:
Apply the following adjustments while following the Amazon documentation:
- Select Ubuntu as the AMI.
- Select the latest supported Ubuntu 24.04 Server AMI.
- Select an instance type that meets the recommended specifications.
- Configure the key pair and network settings according to your organisation’s policies. Ensure network settings fulfil the communication requirements.
- Configure storage according to the system-disk and data-disk requirements for the selected NTA size.
- In Advanced details, paste the contents of the AWS
cloud-init.yamlfile into User data. Do not select User data has already been base64 encoded. - Complete the remaining instance configuration according to your organisation’s requirements and the Amazon documentation.
- Configure VPC Traffic Mirroring so that the selected traffic is sent to the NTA monitoring interface.
- Continue to Deployment status.
Deployment status
After deploying the NTA, view deployment progress and status in the SamurAI Portal.
- Log in to the SamurAI Portal.
- Select Telemetry, and then select Network Traffic Analyzer from the main menu.
- Select the relevant NTA.
- Under General, the Status initially displays as Provisioning.
- Review Deployment Status, which displays deployment phases and timestamps. Each completed phase is shown in green.
| No. | Deployment status message | Description |
|---|---|---|
| 1 | Initial call to backend. Network connectivity ok | The NTA has sent its first message to the SamurAI backend and enrolment has started. |
| 2 | Refreshing OS package lists | Refreshing operating-system software repository information. |
| 3 | Upgrading packages | Starting operating-system updates. |
| 4 | Finished upgrading packages | Operating-system update completed. |
| 5 | Base OS update completed | Post-update operating-system maintenance jobs completed. |
| 6 | Initiating CTS Build X | NTA installer downloaded and started. |
| 7 | Running verification to ensure minimal requirements | Installer is verifying minimum requirements and software settings. |
| 8 | Completed verification to ensure minimal requirements | Verification completed. |
| 9 | Request device_id | Requesting device identity. |
| 10 | Request init | Starting the registration process. |
| 11 | Initiator successfully contacted backend | Contacting the backend to retrieve basic operating information. |
| 12 | Downloading configuration | Downloaded configuration. |
| 13 | Logged in to dockerhub | Authorised to Docker Hub to access private containers. |
| 14 | Downloading Docker containers | Containers downloaded from Docker Hub and ready for use. |
| 15 | Storing device configuration to the backend | Sending device information to the backend. |
| 16 | Starting Manager | Starting NTA Manager. Additional software or containers may download in the background. |
- When NTA deployment is complete, Status initially displays as Not Healthy while individual components start. The status changes to Healthy when startup is complete, which can take approximately five minutes.
Configure traffic mirroring
After deployment, determine the NTA monitoring interface before configuring traffic mirroring.
- Log in to the SamurAI Portal.
- Select Telemetry, and then select Network Traffic Analyzer from the main menu.
- Select the relevant NTA.
- Select System Information and review Network to identify the Management and Monitoring interfaces. Record each MAC address and confirm that it matches the relevant hypervisor or AWS configuration.
- Configure traffic mirroring to send the required traffic to the NTA monitoring interface. Refer to your deployment platform documentation because mirroring implementations differ between environments.
Useful vendor documentation includes:
VMware vSphere
Microsoft Hyper-V
The following Microsoft documentation uses Microsoft Defender for IoT examples, but its traffic-mirroring concepts also apply to NTA deployments:
KVM-based environments
Use the traffic-mirroring capability of the KVM platform, virtual switch, bridge, or network fabric that carries the traffic you want to monitor. Examples include Open vSwitch port mirroring and platform-specific bridge or switch mirroring.
Amazon EC2
Detection testing
After deploying the NTA, validate that network traffic is monitored and analysed correctly.
The NTA includes a built-in test detection signature that triggers on ICMP Echo Request traffic with a payload size of 333 bytes. This allows you to validate end-to-end traffic visibility and detection without affecting normal operations.
Generate test traffic
Generate ICMP traffic using one of the methods below.
Windows
From Command Prompt, run:
ping -l 333 X.X.X.X
Linux
From a terminal, run:
ping -s 333 X.X.X.X
Cisco routers and switches
Use Extended Ping and specify a datagram size of 361 bytes.
The Extended Ping datagram size includes:
- IP header: 20 bytes.
- ICMP header: 8 bytes.
- ICMP payload: 333 bytes.
Total: 361 bytes.
Expected detection
After generating the test traffic, the NTA should generate the following alert:
Test Alert using ICMP size 333 for NTA validation
View this alert in the NTA Alerts panel. Refer to Alerts for more information.
- The detection is triggered by the ICMP Echo Request. A reply from the destination host is not required.
- The test signature does not affect traffic analysis or detection accuracy and is safe to use for validation.
If no alert is generated
If no alert is shown after generating the test traffic, verify the following:
- Test traffic was generated from a network segment monitored by the NTA.
- Traffic from the source network is mirrored to the NTA.
- The NTA is receiving traffic on the monitoring interface.
- The ICMP Echo Request used the correct 333-byte payload size.
- Sufficient time has been allowed for the alert to be processed and displayed.
If all checks pass and no alert is generated, submit a ticket through the SamurAI Portal.
Delete an NTA
To delete an NTA:
- In the SamurAI Portal, select Telemetry, and then select Network Traffic Analyzer.
- Select the relevant NTA.
- Select the More options icon and then select Delete NTA.
- Review the warning. To confirm the destructive action, enter
DELETEand select Delete NTA.
What’s next?
You have now deployed and configured your NTA. Refer to NTA Details.
4.3 - NTA Details
In this article all elements of the Network Traffic Analyzer are outlined to help you understand the panels available.
List all NTAs
Login to the SamurAI Portal
Click Telemetry and select Network Traffic Analyzer from the main menu
A list of all NTAs will be displayed. Various fields are displayed based on information you included when creating the NTA.
Click on an entry to drill into an NTA’s details.
General
The General panel of an NTA provides an overview of the NTA and status.
| Field | Description |
|---|---|
| Status | Status of the NTA. See NTA status for list of potential statuses |
| Description | A decription field for your NTA. You can edit this field at any time |
| Location | Populated from Location specified during creation of the NTA |
| Hostname | Hostname specified during creation of the NTA |
| Size | The size selected during creation of the NTA |
NTA Status
| Indicator | Status | Description |
|---|---|---|
| Pending | NTA components installing / provisioning or awaiting status | |
| Unknown | The SamurAI platform is unable to determine a status | |
| OK | Healthy | |
| Warning | Warning status will be displayed if the NTA is experiencing any issues e.g components are experiencing problems | |
| Critical | Critical status will be displayed and an email notification will be sent to registered users if the SamurAI platform cannot communicate with the NTA |
Current Status
The Current Status widget provides a visual representation of the CPU, Memory and Disk usage of the NTA. Each metric is displayed as a half-donut chart, offering a quick visual snapshot of system load.
| Metric | Description |
|---|---|
| CPU Utilization | Displays the percentage utilization across all CPU cores. |
| Memory Utilization | Displays the percentage of system memory consumed. |
| Disk Utilization / | Represents the percentage of storage space used for the system disk. |
| Disk Utilization /srv | Represents the percentage of storage space used for the data disk. Monitoring this metric ensures sufficient space for data/memory cache |
This widget may also include status messages of individual components of the NTA, this will assist with identifing any problems and should be included if you submit a ticket with the SamurAI SOC.
NTA Notifications
The SamurAI platform will send email notifications to registered users should your NTA status change to Critical. Once any issues have been resolved, you will also be notified again when rectified. Users have the option to enable or disable notifications.
Additionally the SamurAI platform will send push notifications if the SamurAI Portal is installed as an app (Progressive Web App - PWA) and notifications are configured within user settings.
Enable or Disable Notifications
- From the NTA Table view, click on More Options () to the right of the NTA View
- Select Notifications Settings
- Toggle the setting to enable or disable by selecting the relevant icon per listed NTA. Alternatively you can select the default setting (send notification).
- Click Save.
You can also achieve this per individual NTA by:
- From the NTA Table view, click on More Options () to the left of the NTA.
- Select Notifications
- Toggle the setting to enable or disable by selecting the relevant icon. Alternatively you can select the default setting (send notification).
- Click Save.
System Information
The System Informatiom panel displays important NTA system information and metrics including:
System
| Field | Description |
|---|---|
| Operating System | The NTA leverages Ubuntu, it is our repsonsibility to maintain the Operating System. |
| CPU | CPU information captured |
| Cores | No. of physical and logical cores of the NTA |
| Memory | Total memory of the NTA |
| Swap | Allocated disk space used as virtual memory |
Storage
| Field | Description |
|---|---|
| Mount | Directory where storage device or parition is attached to the file system |
| Device | Represents the virtual storage medium by path or Amazon EBS volume |
| Size | Capacity of storage device or partition |
| Usage | Amount of storage consumed in % |
Network Management
| Field | Description |
|---|---|
| Configuration | Static or DHCP |
| IPv4 | The assigned IP address. The Monitoring interface will not have an IP address |
| Proxy server | Proxy server configured during cofiguration creation |
| NTP servers | Network time protocol servers configured during configuration creation |
| Interface | Virtual adapter |
| Type | Management interface |
| MAC | Unique identifier assigned to the interface |
| Current Bandwidth | The data transfer rate of the network interface measured in Mbit/s |
Network Monitoring
| Field | Description |
|---|---|
| Interface | Virtual adapter |
| Type | Monitoring interface |
| MAC | Unique identifier assigned to the interface |
| Current Bandwidth | The data transfer rate of the network interface measured in Mbit/s |
Metrics
All metrics displayed are by default over the past 2 hours however you can adjust via the Time Picker
| Metric | Description |
|---|---|
| CPU Utilization | Displays the percentage utilization across all CPU cores. High usage may indicate heavy traffic analysis or potential system strain |
| Memory Utilization | Displays the percentage of system memory consumed. Persistent high usage could impact performance and may require optimization |
| Disk Utilization | Represents the percentage of storage space used across each disk mount. Monitoring this metric ensures sufficient space for traffic data and system operations |
| Bandwidth Utilization | Displays bandwidth utilization of the mirror interface in Mbit/s |
Alerts
The Alerts panel displays security detections made by the NTA.
You do not have to act on any alerts as the SamurAI SOC analysts triage, investigate and validate alerts as part of the Managed Detection & Response (MDR) service.
As alerts are validated by the SamurAI SOC analysts and investigated, they may potentially lead to a reported Security Incident and are marked accordingly. Our strategy includes visibility and transparency of the service we provide to you therefore this feature provides you that visibility showcasing the value of the NTA and service.
Alerts Summary
Alerts are summarized in a panel which can be updated based on a specified time period and includes:
- Security Incidents - the total number of security incidents reported to you that may correspond to one or more alerts.
- Alerts - the total number of alerts detected by the NTA.
- Real-time engine- the total number of alerts created by the NTA resident SamurAI real-time engine.
- Vendor - the total number of alerts created by the NTA resident Intrusion Detection System (IDS) - Suricata.
Filters
Various filters are available to determine the alerts to be displayed.

Figure 1: Time and Display filter
The total number of alerts within the alerts table in displayed to the left of the Time Period filter.
Time period
You can update all panels to specific date and time ranges. We default to the Last 24 hours however have included Quick time ranges.

Figure 2: Date and time selection
Display Filter
Enter any values you wish to filter and highlight within the display filter.

Figure 3: Display filter
Alert Column Filter
Adjust and show/hide any of the column values within the Alert Table.

Figure 4: Alert column filter
Alerts Table
All alerts related to the NTA are listed within the alert table, it is important to note is that the table is limited to 10,000 alerts therefore apply filters to narrow the results.
For description of each field within the Alert table refer to Alerts Table
5 - SamurAI Endpoint Agent
What is the SamurAI Endpoint Agent?
The SamurAI Endpoint Agent is a light weight, software component installed on an endpoint (such as a workstation or server) providing deep visibility and enabling SamurAI Managed Detection and Response across your endpoints. Capabilities include:
Telemetry Data Collection
- Standardized and targeted telemetry data collection independent of operating system (e.g the agent utilizes a custom Sysmon configuration, specifically tuned for the SamurAI Platform applied to Microsoft Windows to optimize event collection and analysis).
- Eliminates the need for 3rd party integrations to the SamurAI Platform (e.g winlogbeat agents installed on the Microsoft Windows OS).
- Eliminates the need for any endpoint configuration in telemetry collection.
Detection
- Leverages the SamurAI Real-Time Engine for detection of threats.
- We apply our global threat intelligence feeds to enrich data with context about known malicious actors, emerging threats, and attack patterns enhancing accuracy and speed of threat detection.
- Leverages the SamurAI Hunting Engine for automated and analyst driven threat hunting.
Investigate
- Provides a powerful query capability (osquery) with real-time visibility into endpoints (e.g query for installed browser extensions to help analysts detect potential persistance mechanisms used by threat actors and accelerate investigations).
- Event driven threat hunting to investigate, validate and contextualize a threat/incident.
Respond
- Provides incident response tooling and aids endpoint forensics.
What’s Next?
Review the SamurAI Endpoint Agent Support and Pre-requisites.
5.1 - Support and Pre-requisites
Listed below are supported Operating Systems (OS) and communication pre-requisites. If you do not see a specific OS version listed please reach out to us.
Supported Operating Systems
| Operating System | Supported Version |
|---|---|
| Microsoft Windows |
|
Communication Pre-Requisites
Ensure endpoints with the SamurAI Endpoint Agent installed have the following network connectivity:
| Source | Destination | Ports | Description |
|---|---|---|---|
| SamurAI Endpoint Agent | spiral-node-api.td.nttsecurity.io | TCP/443 |
|
What’s Next?
Now you have an understanding of support and pre-requisites, learn about Download and Installation.
5.2 - Download and Installation
Before you begin download and installation of the SamurAI Endpoint Agent you must first select how you wish to manage SamurAI Endpoint Agent Updates and decide settings for the SamurAI Endpoint Agent for Windows.
- From the SamurAI Portal select Telemetry and click SamurAI Endpoint Agent
Upon first navigation to this page, the following will be displayed:

Figure 1: SamurAI Endpoint Agent settings
Updates
Select how you want to manage SamurAI Endpoint Agent updates:
- Auto Managed : Auto updates of agents is enabled by default, this option will automatically update agents as new versions are released without any action needed on your part.
- Self Managed : Select this option should you wish to manage updates yourself. See Self Managed for more information.
SamurAI Endpoint Agent for Windows
- Determine whether to Accept Microsoft Sysinternals Software Licence Terms (Sysmon EULA).
If you accept the Sysmon EULA, you can select to Install Sysmon if missing
Click Apply SamurAI Endpoint Agent Settings
The SamurAI Endpoint Agent and Sysmon
For enhanced telemetry on Windows, the SamurAI Endpoint Agent optionally leverages Microsoft System Monitor (Sysmon), a vital component for collecting detailed process and system activity. Read more about Sysmon from Microsoft Documentation.
Sysmon is not bundled with the SamurAI Endpoint Agent therefore if you Accept Microsoft Sysinternals Software Licence Terms (Sysmon EULA) upon installation of the SamurAI Endpoint Agent, sysmon will be downloaded and installed or updated silently using standard Microsoft provided installation flags.
The SamurAI Endpoint Agent leverages a custom Sysmon configuration tuned and maintained by the SamurAI detection engineering team. This provides:
Noise reduction: a default Sysmon deployment generates an extremely high volume of data, our tuned configuration filters out unnecessary events which are irrelevant for SamurAI Managed Detection and Response.
High Fidelity detections: we selectively enable and enrich valuable event IDs (e.g process creation, network connections, registry modification etc) aligned with the MITRE ATT&CK framework.
Consistency across environments: ensures standardized event coverage across deployments.
Ongoing Tuning: we regularly update the configuration to reflect emerging attacker techniques, new ATT&CK mappings and lessons learned.
What’s Next
You can now proceed to Agent Download
5.2.1 - Download
To download the SamurAI Endpoint Agent follow the steps below:
Login go the SamurAI Portal
Click Telemetry and select SamurAI Endpoint Agent from the main menu
Click Installers
Select the relevant installer based on your operating system and click Download
Verify Download
Microsoft Windows
To ensure your download has not been corrupted or tampered with, you can validate it’s checksum using the built-in Windows tool ‘certutil’.
Run the following command and view the checksum to ensure it matches the installer within the SamurAI Portal:
c:\certutil -hashfile spiral-windows-amd64.msi sha256
example:
c:\certutil -hashfile spiral-windows-amd64.msi sha256
SHA256 hash of spiral-windows-amd64.msi:
85193aa8c4e7a1eaba1da36251bc6ea78e0e62b2
CertUtil: -hashfile command completed successfully.
What’s Next?
Based on your Operating System jump to the relevant SamurAI Endpoint Agent installation guide:
5.2.2 - Microsoft Windows
Manual Installation
Locate the Windows MSI installer file that you previously downloaded and double-click, a small progress window will appear which does not require any interaction.
Additional commands are available using the command line as outlined below. All commands can be used in combination as required.
Proxy Support
If your organization leverages a proxy then use the following command during install:
Example:
msiexec.exe /i "spiral-windows-amd64.msi" PROXY=http://<ip>:<port>
This will create a key in the Windows registry: Computer\HKEY_LOCAL_MACHINE\SOFTWARE\NTT\Spiral with a parameter Proxy with the proxy from the command line.
This can be added/changed/removed at a later time, if so the SamurAI Endpoint Agent services must be restarted.
Quiet Mode Installation
Use the the following command for quiet mode installation (i.e no progress window is displayed):
msiexec.exe /i "spiral-windows-amd64.msi" /qn
Verbose Installation Logs
If you wish to view installation logs you can use the following command to save logs to a file for review:
Example:
msiexec.exe /i "spiral-windows-amd64.msi" /L*vx output.txt
Validate installation
After the installation has completed, there will be a Spiral entry under installed programs.

Figure 1: Windows apps & features
The installation folder is C:\Program Files\Spiral with full control permissions to SYSTEM and Administrators.
This should apply to all subfolders and files with one exception osquery.db which will have an additional read access to Everyone/World.

Figure 2: SamurAI Endpoint Agent Windows install path and files
There will also be a service named Spiral running.

Figure 3: Task manager service
The Spiral process will also be visible.

Figure 4: Task manager process
Additionally osquery processes will be running.

Figure 5: osquery processes
The following files are created by the installer:
C:\Program Files\Spiral\bin\spiral.exe: The Spiral launcher (more details what it does and functions further down)
C:\Program Files\Spiral\bin\osqueryd.exe: The Osqueryd binary that will be launched by spiral.exe (more details further down)
C:\Program Files\Spiral\config.yaml: The configuration for Spiral launcher
C:\Program Files\Spiral\secret: The embedded tenant/enrollment secret
C:\Program Files\Spiral\ca.pem: Spiral CA bundle used to communicate with the SamurAI platform. Will download new if missing or if outdated. Used by both spiral.exe and osqueryd.exe.
The following files are created by either the Spiral or Osquery process:
C:\Program Files\Spiral\server.crt: Exported server certificate chain from Spiral Node API (typically excluding Root CA).
C:\Program Files\Spiral\sysmon.xml: The sysmon configuration downloaded from Spiral Node API.
C:\Program Files\Spiral\data\osquery.db: RocksDB data folder used by Osquery for state keeping. Osquery sets this with read access to Everyone/World at intervals.
C:\Program Files\Spiral\data\extensions.load: Purposely left empty
C:\Program Files\Spiral\data\osquery.flags: Osquery startup flags (generated by Spiral), extended configuration is fetched by Osquery over HTTPS.
C:\Program Files\Spiral\data\osquery.log: Stdout/stderr log output from osqueryd.exe
C:\Program Files\Spiral\data\osquery.pid: Osquery PID
C:\Program Files\Spiral\data\osquery.uuid: UUID for this specific node
C:\Program Files\Spiral\data\spiral.log: Stdout/stderr log output from spiral.exe
C:\Program Files\Spiral\data\shell: A folder created if running spiral.exe with "shell" command which is an interactive mode to run Osquery commands.
Dependant on your selection for SamurAI Endpoint Agent for Windows the agent may:
- Download Sysmon from Microsoft official servers.
- Install or update Sysmon silently using standard Microsoft provided installation flags.
- Modify Sysmon with the configuration.
Review Deployed SamurAI Endpoint Agents
Review and Manage within the SamurAI Portal.
5.3 - Management
View Nodes
To view all deployed agents:
Login go the SamurAI Portal
Click Telemetry and select SamurAI Endpoint Agent from the main menu.
Dashboard
The dashboard panel displays summary information:
- Nodes: the total deployed and seen by the SamurAI platform
- Online: the total currently online (have communicated with the SamurAI platform within five minutes)
- Offline: the total number offline (have not communicated with the SamurAI platform for five minutes)
- Platforms: the total number of platforms i.e Windows / MacOS / Linux
Nodes Table
A table displays all deployed agents with node specific information:
| Field | Description |
|---|---|
| ID | Universally Unique Identifier (UUID) of the node |
| Status Description | Status of the agent. Potential status displayed: Online or Offline |
| Name | Hostname of the endpoint |
| Platform | Platform and architecture - icon depicting OS and processor e.g AMD64 |
| OS Name | The underlying operating system |
| OS Version | The operating system version |
| Agent Version | The SamurAI Endpoint Agent version installed |
| Sysmon Version | The System Monitor (sysmon) version installed |
| Last external IP | The external IP address of the agent as seen by the SamurAI platform |
| Last Seen | Date and timestamp of when the agent last checked-in to the SamurAI platform |
| Inactivity Threshold | An indicator displaying time until the agent will be deemed inactive and purged from view |
Inactive Node(s)
Nodes communicate with the SamurAI platform every minute and are marked offline if no communication is received after five minutes.
Offline nodes will be visible for 90 days, after this threshold it is deemed to be inactive and purged from the SamurAI platform backend and the current view.
You can view inactive and deleted nodes within the Node History.
Delete Node(s)
You can delete nodes from the table:
- Select the nodes you wish to Delete
- Click Actions and select Delete selected nodes
- To ensure you intended to delete the agents you will need to type DELETE in the field and select Delete
- The deleted node record will appear under Node History.
Node History
The Node History log displays a table of Deleted Nodes and Purged (deemed inactive) with node specific information:
| Field | Description |
|---|---|
| ID | Universally Unique Identifier (UUID) of the node |
| Action | The action taken against the node. This could include Purged based on the inactivity threshold or Deleted |
| Name | Hostname of the endpoint |
| Last Status | The Last known Status of the node (typically offline) |
| OS Name | The underlying operating system |
| User | The user that deleted the node. This could also include System which denotes the SamurAI platform when the node is inactive and purged |
| Last Enrolled | Date and timestamp of when the node was originally enrolled |
| Action Applied | Displays when the Action was applied to the node |
5.3.1 - Settings and Updates
Settings
You can change the Update and Sysmon EULA selections by clicking Settings from the SamurAI Endpoint Agent view.
- Auto Managed : Auto updates of agents is enabled by default, select this option if you want the agent updates to occur automatically without any action needed on your part.
- Self Managed : Select this option should you wish to manage agent updates yourself.
Updates
Self Managed
If Self Managed is selected a new option entitled Update Tasks is displayed.
Update Tasks
Selecting Update Tasks allows you to configure tasks for updating your deployed agents.
- Click on Create Update Task
Enter a Name for the task e.g Windows 10 Pro Update
Toggle whether you wish to Start immediately. If you do not start the task immediately you have the option to update the status at a later date/time. See Update the Task.
Select whether you wish to update:
- SamurAI Agent version (the latest version will always be displayed)
- Sysmon version
Rate Limit is enabled by default to 5 nodes per 1 minute. Read more about Rate Limiting
Once complete, select Review Selection and review your tasks
Click on Create Update Task
Rate Limiting
Rate limiting allows you to roll out updates to nodes gradually instead of updating all at once. This controlled approach reduces risk of disruption, avoids overloading networks and ensures that if an unexpected issue occurs, only a small number of nodes are affected.
Rate limiting allows you to configure the number of nodes to update per time duration (which can be set per minute/hour/day).
When rate limiting is recommended:
- Large fleets (typically 500+ nodes)
- Networks with remote sites, VPN’s or limited bandwidth
- Critical workloads where uptime and stability are essential
- Major agent version upgrades or significant configuration changes
When rate limiting may not be necessary:
- Small fleets with a few hundred nodes
- Minor, low-risk updates
Rate limit upper limits are set as:
- 25 nodes per 1 minute, 50 nodes per 2 minutes etc
- 1500 nodes per 1 hours, 3000 nodes per 2 hours etc
- 36000 nodes per 1 day, 72000 nodes per 2 days etc
View Update Tasks
- From the SSamurAI Endpoint Agent view, click Update Tasks.
A table displays all Update Tasks with specific information:
| Field | Description |
|---|---|
| Status | Status of the Update Task (hover over for text, potential status displayed Paused/Running/Completed/Failed |
| Status Description | Status Description (potential status displayed Paused/Running/Completed/Failed |
| Name | Name provided for the task |
| Sysmon Version | Updated Sysmon version (if applicable) |
| Agent Version | Updated SamurAI Endpoint Agent version |
| Target Node Count | The number of nodes within the update task |
| Completed Node Count | The number of completed node updates |
| Failed Node Count | The number of failed node updates |
| Created | Date/Timestamp of update task creation |
| Updated | Date/Timestamp of updates to the update task |
Select an Update Task from the list to display status of individual node updates.
A summary will be displayed including:
- Update task status
- Number completed
- Number failed
- Target
- Rate Limit
Additional details for each node are also included:
| Field | Description |
|---|---|
| Name | Hostname of the node to be updated |
| Node Update Task Status | The status of the node update, potential status are New/Pending/Completed/Failed |
| Message | A short description of progress |
| Start Date | Date/Timestamp of agent update |
| End Date | Date/Timestamp of agent update end |
| Agent before | SamurAI Endpoint Agent version before the update |
| Agent after | SamurAI Endpoint Agent version after the update |
| Sysmon before | Sysmon version before update |
| Sysmon after | Sysmon version after update |
Update the Task
You can update the State of an Update Task to either Paused or Running.
For example, if you previously set an Update Task NOT to Start Immediately you can set the state to Running to begin the update:
From the Update Tasks list select the relevant Update Task
Select More Options (
 ).
).Click Update the Task
Select the State to Paused to pause the update task or to Running to begin or resume the update task.
5.4 - Uninstall
Follow the steps to uninstall the SamurAI Endpoint Agent based on your Operating System:
Microsoft Windows
Go to Add or remove programs
Find Spiral Agent
Click Uninstall
When uninstalled, program files and registry entries are removed from the endpoint/node, however some files may remain:
- All files not added by the installer itself such as the Data folder in C:\Program Files\Spiral\Data
- Files server.crt and sysmon.xml in C:\Program Files\Spiral remain after uninstall.
It is safe to delete C:\Program Files\Spiral after the uninstall has completed.