Integrations
What is an Integration?
A data source integrated with the SamurAI platform. An integration allows us to collect and ingest telemetry data from multiple sources, including network, endpoint and cloud.
What integrations are available?
We have pre-built integrations to a comprehensive array of 3rd party products and services. Select Supported Integrations to view what is available.
For syslog sources, even if events do not match a supported Integration, we will still ingest events into our data lake as a Generic Log Source. You will still be able to process this data using Advanced Query, and include events from generic log sources within your queries.
How do I integrate data sources?
Select Create for steps to integrate data sources.
Integration Health
Once you have configured Integrations to bring your data into the SamurAI platform, you will also want to make sure that your data sources are healthy. For more details on how to maintain Integration health and troubleshoot problems, please read our article about Integration Health.
What’s Next?
Upon completion of your integrations and validation of health, the platform will start collecting and ingesting telemetry data. Dependent on your phase of MDR onboarding our team will be in contact with you.
1 - Supported Integrations
Integrations facilitate the ingestion of data sources from a wide range of third party vendors. Our Integrations are updated regularly as new and emerging technologies are released.
Each Integration typically requires a configuration guide outlining steps you must follow to integrate your data source to the SamurAI platform.
For details such as transport methods and logs collected please refer to each supporting vendor configuration guide by clicking the link in the table or browsing directly to Product Integration Guides.
All supported integrations are categorized according to our Detection Categorization. For further information refer to the following article: Telemetry Data Source Categorization.
If you do not see an integration guide available, please reach out to your NTT contact for further information as we are constantly developing support for additional data sources.
Available configuration guides
In the pipeline
Outlined below are integrations we have in the pipeline however have no committed dates for support. Please note any integration may be influenced by changing business opportunities and client requirements. Please contact NTT for further information or if you require additional support.
| Vendor | Product |
|---|
| Cloudflare | Cloudflare |
| OpenBSD | Packet Filter |
| Skyhigh Security | On-Premises SWG |
| Netskope | Netskope SSE |
2 - Create
Create Integration
- From the SamurAI Portal click Telemetry and select Integrations from the main menu.
- Click Create integration.
- Select the product you wish to integrate with the SamurAI platform.
- Click Next. Dependent on how we collect telemetry, the product may be integrated via a Cloud Collector or Local Collector. Follow the steps based on the Collector type:
Cloud Collector
- If the integration is cloud-based you need to select the relevant Cloud Collector. Select the relevant Cloud Collector and click Next.
- If you are using a public cloud storage account you should already have completed the steps in Cloud Collector.
- If no cloud storage is utilized then a default cloud collector is available.
- Select Configuration Guide which will direct you to SamurAI documentation outlining how to configure your product and obtain required fields.
- Once you have configured your product, complete the required fields.
- Select Finish.
Local Collector
- Your Local Collector(s) will be listed. Select the Local Collector that you will integrate the product with.
- Click Next (typically this is the syslog destination host when configuring your device). If you do not have a Local Collector setup and deployed, follow the steps in our SamurAI Local Collector article.
- The Local Collector IP Address will be displayed, copy the IP address or take note of it.
- Click Configuration Guide which will direct you to SamurAI documentation outlining how to configure your product.
- Based on the product, Extended Data Collection may be displayed, if so jump to Extended Data Collection.
- Click Finish
You do not need to follow the steps above for a Local Collector integration without extended data collection, however we advise you follow the steps to determine if extended data collection is available for the product, and if you wish to enable it. You may choose to follow our integration guides to send logs directly to your Local Collector, the SamurAI platform will auto detect the vendor and product for supported integrations. If we do not support the product, your integration will be displayed as unknown under the Vendor and Product fields, however the SamurAI platform will still store the telemetry data.
Extended Data Collection
For many products we are able to collect extended data enhancing our threat detection capabilities and accuracy, for example Packet Capture (PCAP) data. This option will be displayed during configuration of an integration.
- If extended data collection is available for the product, you can choose to enable or disable via the toggle. If you choose to disable, Select Finish
- If you choose to enable extended data collection you must complete all the necessary fields. The parameters for each field are derived from following the associated product configuration guide. Once complete, Select Finish
You can choose to follow the configuration guide at anytime during the process, however if your product is not configured, the SamurAI platform will obviously not receive any telemetry.
All supported third-party product configuration guides can be found
here.
3 - High Availability
If you have products configured in a High Availability configuration e.g. Active/Passive pair you have the option to configure HA Groups.
HA Groups are important for telemetry health monitoring and notifications. An example scenario is if you have an Active/Passive product configuration where the Active node consistently sends data to a local collector, however the Passive node sends intermittent data. In this scenario the Active node status would be reported as OK, however the Passive node status may appear as Critical despite there not being a telemetry ingestion problem.
HA Group telemetry monitoring is handled based on the ‘best’ state of all members e.g in the scenario above if a HA Group has two members and one member has an OK status, and the second member has Critical status the overall group state will be considered OK.
Email notifications are sent per HA Group and not per individual group member.
Create HA Group
HA Groups are limited to integrations of type Log.
- Click Telemetry and select Integrations from the main menu
- Click
 (more options) at the top right of the table and select Create HA Group
 - A Create HA Group window will be displayed
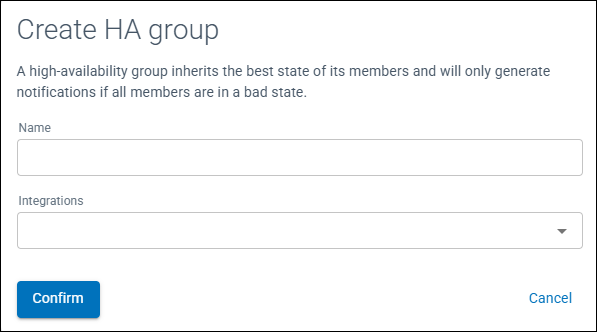
Figure 1: Create HA Group window
- Enter a Name for the HA Group
- From the drop down menu select the integrations to be members of the HA Group
- Click Confirm
Within the Integrations table, the field type HA Group will be displayed with the number of members highlighted.
If you configure HA Groups it is recommended to review and adjust
Status thresholds as necessary for group members.
Edit a HA Group
- Click Telemetry and select Integrations from the main menu
- Click on (more options) to the left of the HA Group and select Edit HA Group
- Add or remove the group members required
- Click Confirm
There must be a minimum of two members of a HA Group, there are no maximum limitations.
Delete HA Group
- Click Telemetry and select Integrations from the main menu
- Click on (more options) to the left of the HA Group and select Delete HA Group
- A confirmation window will be displayed, Click Confirm
The HA Group will be deleted and integrations listed within the table.
4 - Details and Status
View Integration
There are multiple methods of viewing your integrations.
To view integrations associated with a specific collector:
- From the SamurAI Portal click Telemetry and select Collectors from the main menu
- Select the relevant Collector
- All integrations associated with the Collector will be displayed with associated information
You can also view all integrations regardless of collector:
- Click Telemetry and select Integrations from the main menu
- An Integrations table will be displayed with all of your Integrations listed
Click on the specific integration to view configuration parameters. You can edit and update a description to help keep track of the integration.
A single product integration may be displayed multiple times based on telemetry data ingested. For example, if you enabled
Extended Data Collection whilst
creating an integration the individual product will be displayed multiple times with different
Type fields.
For integrations of type Log an events graph will be displayed. This is a useful indicator of the number of events over a given period and may show spikes and drops in events.
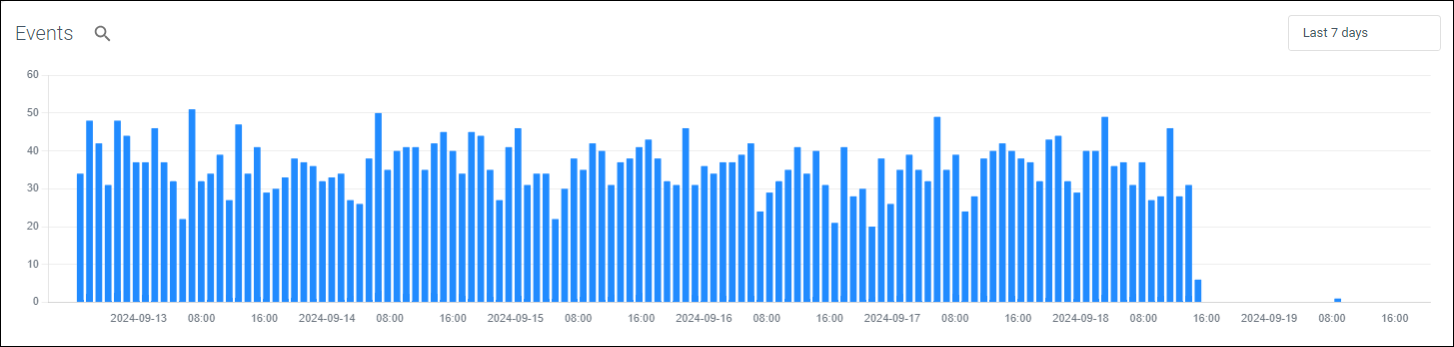
Figure 1: Example events graph
By clicking the time picker you can update the events graph to a specific date and time range. We default to the Last 7 days however have included Quick time ranges.
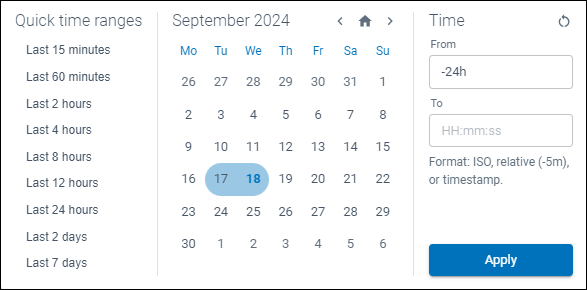
Figure 2: Data and time selector
From the events graph you can pivot directly into Advanced Query by selecting the magnifying glass icon ( ) to view the underlying event data.
Views
You can save filters you set through views. This is useful if, for example, you have a large number of integrations and wish to view only specific products or types of integration.
Click Views to save/reset/delete your different filters. Once saved you can toggle between views.
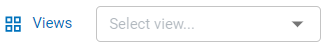
Figure 3: Views drop down
Integration Status
Potential status displayed are included in the table below:
| Indicator | Status | Description |
|---|
| Pending | Telemetry components installing / provisioning or awaiting status |
| Unknown | The SamurAI platform is unable to determine a status or the Vendor/Product are unknown |
| OK | All components healthy |
| Warning | Warning status will be displayed if the SamurAI platform has not seen any events per the defined threshold. Refer to Status Thresholds for additional information |
| Critical | Critical status will be displayed and an email notification will be sent to registered users (by default) if the SamurAI platform has not seen any events per the defined threshold. Refer to Status Thresholds for additional information |
Status Thresholds
Status thresholds are currently limited to integrations of type Log.
The SamurAI platform defines default Warning and Critical thresholds for each integrated product. These thresholds determine when an integration status is reported as Warning or Critical. You can adjust these values per product (e.g for all integrated Palo Alto NG Firewalls) or per integration (e.g for a single Palo Alto NG Firewall). Refer to Custom Thresholds for further information.
To view the default status threshold per product:
- Click on more options (
 ) to the right of the table as depicted:
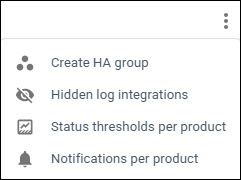
Figure 4: Status thresholds option
- Select Status Thresholds per product
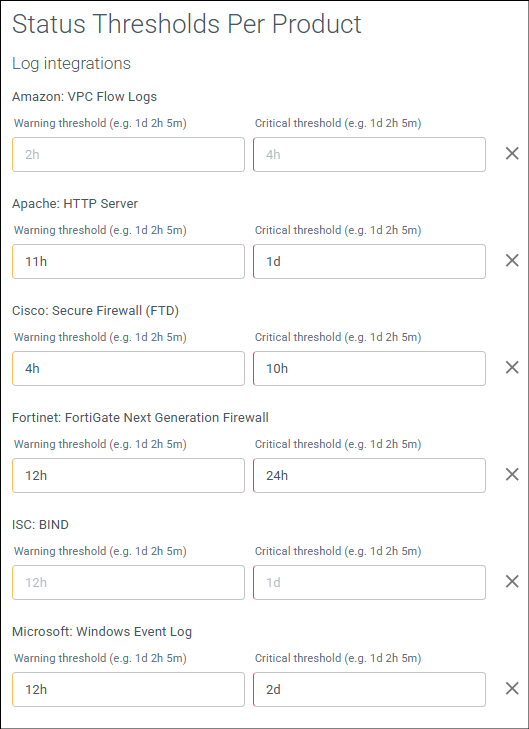
Figure 5: Example default status thresholds per product
Status threshold per product will be displayed, defined in single units or a combination as d (days), h (hours) and m (minutes).
In the example above (Figure 5) for all integrated Cisco: Secure Firewall (FTD) the default thresholds are:
- Warning: 4h. If the SamurAI platform does not receive or ingest any events after 4 hours, the integration status is updated to Warning (displayed within the Integrations Table and the Telemetry Monitoring Table).
- Critical: 10h. If the SamurAI platform does not receive or ingest any events after 10 hours, the integration status is updated to Critical (displayed within the Integrations Table and the Telemetry Monitoring Table, and an email notification is sent to registered users (by default) or as configured by each user.
Custom Thresholds
Custom thresholds are currently limited to integrations of type Log.
Custom thresholds can be set per Product (e.g for all integrated Palo Alto NG Firewalls) and/or per Integration (e.g for a single integrated Palo Alto NG Firewall).
Set thresholds using a single or combination of time units. Use d for days, h for hours and m for minutes e.g 12h or 1d 2h 10m.
Custom thresholds adjusted per Integration will overide Product set thresholds.
Adjust thresholds per Product
- Click on more options () to the right of the table
- Select Status Thresholds per product
- Enter the Warning threshold in days, hours and/or minutes for the Product
- Enter the Critical threshold in days, hours and/or minutes for the Product
- Click Save
Adjust thresholds per Integration
- Click on more options () to the left of the integration
- Select Status Thresholds
- Enter the Warning threshold in days, hours and/or minutes for the integration
- Enter the Critical threshold in days, hours and/or minutes for the integration
- Click Save
Once saved:
- The integration will display an Info icon (
 )
) - Hovering over the icon will display Custom Status Threshold text with the threshold set per status
You can set HA Group thresholds e.g thresholds for all members of the HA Group. You can also set thresholds per member of a HA Group. Member (integration) thresholds will overide the HA Group set thresholds.
Integration Email Notifications
By default email notifications are enabled. The SamurAI platform sends email notifications to registered users when an integration is reported as Critical e.g. the SamurAI platform has not receieved or ingested any data from the integrated product according to the defined threshold, however this is fully customizable.
Email notifications can be set per Product (e.g for all Palo Alto NG Firewalls) and/or per Integration (e.g for a single Palo Alto NG Firewall). Registered users can also customize what email notifications they receive. Refer to User Notifications Settings.
Email notifications adjusted per Integration will overide Product settings.
Enable or disable email notification per Product
- Click on more options () to the right of the table
- Select Notifications Per Product
- Toggle the setting to enable or disable by selecting the bell icon. Alternatively you can select the default setting
- Click Save

Figure 6: Example notification settings
Enable or disable email notification per Integration
- Click on more options () to the left of the integration
- Select Notifications
- A Notifications Settings window will be displayed
- Toggle the setting to enable or disable by selecting the bell icon. Alternatively you can select the default setting
- Click Save
Hide Integration
Hiding an integration will remove it from the integrations displayed and also from the Telemetry Monitoring view and disable notifications.
Only integrations of type Log can be hidden. Some reasons why you may want to hide an integration include:
- You may want to hide all of your unsupported/generic log source integrations.
- And you do not want to receive notifications if there is an issue with telemetry ingestion to the SamurAI platform.
You can also
Disable Notifications if you wish to keep the integration within the integration and monitoring tables.
To hide an integration:
- Find the relevant Log integration within the table
- Click on more options () select Hide integration
- A Hide Log Integration window will be displayed, click Confirm
To view any hidden integrations:
- Click on more options () at the top right of the table and select Hidden log integrations
- A Hidden Log Integrations window will be displayed with hidden integrations
Unhide Integration
- Click more options () at the top right of the table and select Hidden log integrations
- A Hidden Log Integrations window will be displayed
- Find the relevant Hidden integration
- Click on more options () to the left of the integration and select Unhide integration
5 - Delete
Delete Integration
If you delete an integration, it cannot be reversed! but events from the telemetry source will remain within the SamurAI platform. However if the integration is auto-detected, it will reappear as type log if your telemetry source remains sending logs.
If you wish to delete an integration associated with a specific Collector:
- From your SamurAI Portal Telemetry and select Collectors from the main menu
- Select the relevant collector from your list
- You will now see all integrations associated with the collector
- Select your integrations
- On the right hand side of the relevant integration, click on
 (more options) and select Delete Integration
 - The following warning will appear: ‘Warning: This is a destructive action and cannot be reversed.’. To ensure you intended to delete the integration you will need to type in the highlighted ‘Integration’s Hostname’ and select Delete Integration
You can also delete from the Integrations menu item:
- Click Telemetry and select Integrations from the main menu
- Find and select your integrated product
- On the right hand side of the relevant integration, click on (more options) and select Delete Integration
6 - Generic Log Sources
While we make an effort to support a wide variety of Integrations and different types of log sources, it is possible that there may be a log source that you would like to ingest into the SamurAI platform which we are not able to parse and analyze. This is especially true for events generated via syslog log sources.
The fact that we are not able to use a log source for detections doesn’t mean that it won’t still be useful to ingest into the SamurAI platform. We will ingest any event data, provided via syslog (sent to a SamurAI local collector), into our data lake and you will still be able to analyze that event data using Advanced Query. This allows you to include events from generic log sources when you are performing queries.
If you configure an unsupported log source to send syslog to a SamurAI local collector it will be displayed in the SamurAI Portal under Vendor and Product as unknown. However you can provide a description to allow you to keep track of them. Refer to [Integration Articles(/docs/user_guide/telemetry/integrations) for providing a description.
If a log source, ingested via syslog, does not match one of our supported integrations, we will ingest the log events, which will still contain, amongst others, the following fields:
- timestamp: the time at which the log message was ingested
- collector: the id of the collector which ingested the event
- host: the source host from which the event was received
- raw: the complete raw log message
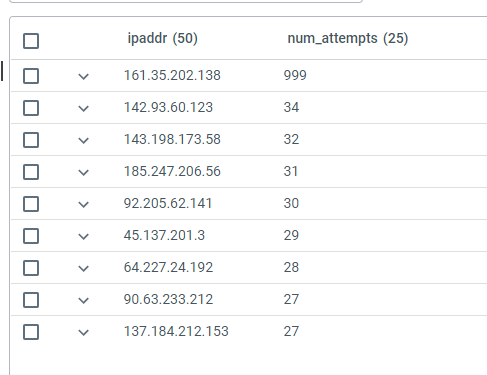
You can then proceed to query these events using Advanced Query. For example, the following KQL query finds all the attempts to connect to a host using invalid user ids and then counts the attempts by source IPv4 or IPv6 address:
events | where host == "10.1.1.1" and i(raw contains "Invalid" or raw contains "failed") and raw !contains "connect" | project timestamp, user = extract("user ([a-zA-Z0-9\\-]+) from ", 1, raw), ipaddr = extract(".+ ([0-9a-f]+[\\:\\.][0-9a-f\\.\\:]+) ", 1, raw) | summarize num_attempts = count() by ipaddr| order by num_attempts
The output is ordered by the number of attempts from each IP address, producing a table like the following: