View Integration
There are multiple methods of viewing your integrations.
To view integrations associated with a specific collector:
- From the SamurAI Portal click Telemetry and select Collectors from the main menu
- Select the relevant Collector
- All integrations associated with the Collector will be displayed with associated information
You can also view all integrations regardless of collector:
- Click Telemetry and select Integrations from the main menu
- An Integrations table will be displayed with all of your Integrations listed
Click on the specific integration to view configuration parameters. You can edit and update a description to help keep track of the integration.
For integrations of type Log an events graph will be displayed. This is a useful indicator of the number of events over a given period and may show spikes and drops in events.
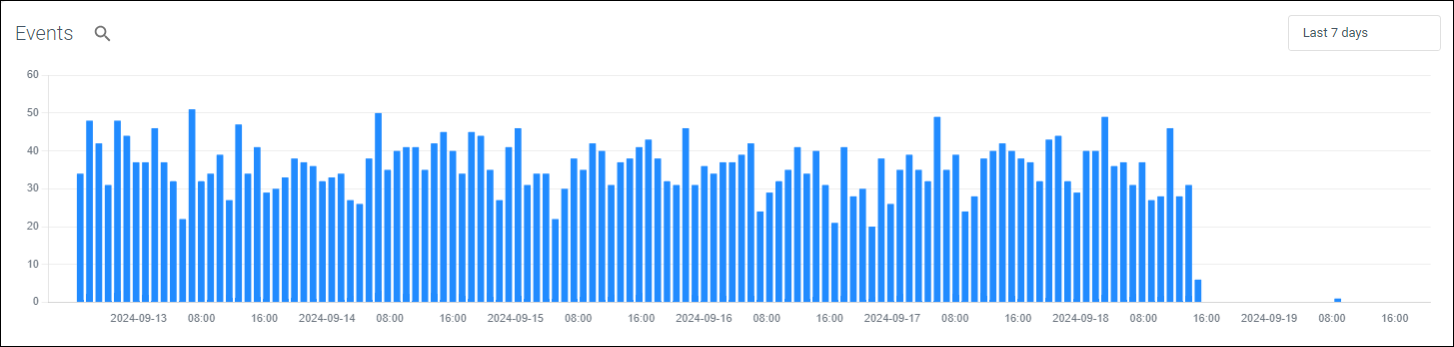
Figure 1: Example events graph
By clicking the time picker you can update the events graph to a specific date and time range. We default to the Last 7 days however have included Quick time ranges.
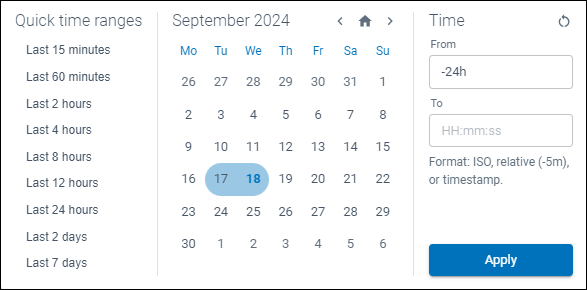
Figure 2: Data and time selector
From the events graph you can pivot directly into Advanced Query by selecting the magnifying glass icon ( ) to view the underlying event data.
Views
You can save filters you set through views. This is useful if, for example, you have a large number of integrations and wish to view only specific products or types of integration.
Click Views to save/reset/delete your different filters. Once saved you can toggle between views.
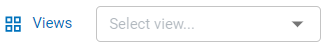
Figure 3: Views drop down
Integration Status
Potential status displayed are included in the table below:
| Indicator | Status | Description |
|---|---|---|
| Pending | Telemetry components installing / provisioning or awaiting status | |
| Unknown | The SamurAI platform is unable to determine a status or the Vendor/Product are unknown | |
| OK | All components healthy | |
| Warning | Warning status will be displayed if the SamurAI platform has not seen any events per the defined threshold. Refer to Status Thresholds for additional information | |
| Critical | Critical status will be displayed and an email notification will be sent to registered users (by default) if the SamurAI platform has not seen any events per the defined threshold. Refer to Status Thresholds for additional information |
Status Thresholds
The SamurAI platform defines default Warning and Critical thresholds for each integrated product. These thresholds determine when an integration status is reported as Warning or Critical. You can adjust these values per product (e.g for all integrated Palo Alto NG Firewalls) or per integration (e.g for a single Palo Alto NG Firewall). Refer to Custom Thresholds for further information.
To view the default status threshold per product:
- Click on more options (
 ) to the right of the table as depicted:
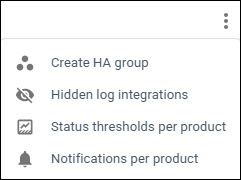
Figure 4: Status thresholds option
- Select Status Thresholds per product
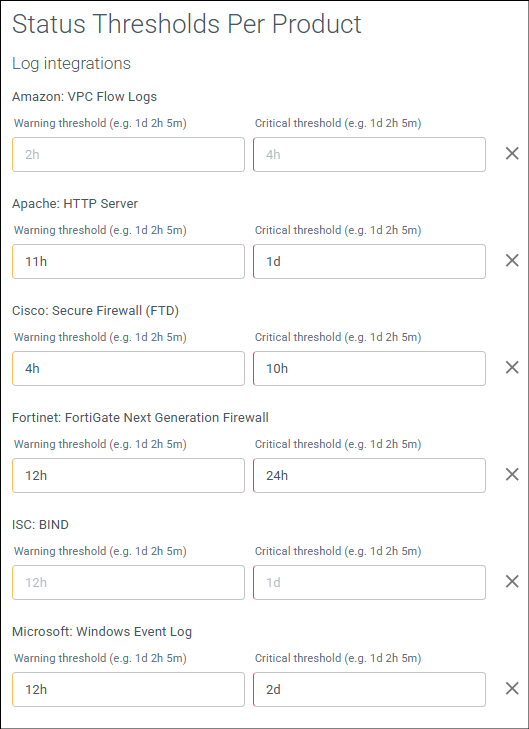
Figure 5: Example default status thresholds per product
Status threshold per product will be displayed, defined in single units or a combination as d (days), h (hours) and m (minutes).
In the example above (Figure 5) for all integrated Cisco: Secure Firewall (FTD) the default thresholds are:
- Warning: 4h. If the SamurAI platform does not receive or ingest any events after 4 hours, the integration status is updated to Warning (displayed within the Integrations Table and the Telemetry Monitoring Table).
- Critical: 10h. If the SamurAI platform does not receive or ingest any events after 10 hours, the integration status is updated to Critical (displayed within the Integrations Table and the Telemetry Monitoring Table, and an email notification is sent to registered users (by default) or as configured by each user.
Custom Thresholds
Custom thresholds can be set per Product (e.g for all integrated Palo Alto NG Firewalls) and/or per Integration (e.g for a single integrated Palo Alto NG Firewall). Set thresholds using a single or combination of time units. Use d for days, h for hours and m for minutes e.g 12h or 1d 2h 10m.
Adjust thresholds per Product
- Click on more options () to the right of the table
- Select Status Thresholds per product
- Enter the Warning threshold in days, hours and/or minutes for the Product
- Enter the Critical threshold in days, hours and/or minutes for the Product
- Click Save
Adjust thresholds per Integration
- Click on more options () to the left of the integration
- Select Status Thresholds
- Enter the Warning threshold in days, hours and/or minutes for the integration
- Enter the Critical threshold in days, hours and/or minutes for the integration
- Click Save
Once saved:
- The integration will display an Info icon (
 )
) - Hovering over the icon will display Custom Status Threshold text with the threshold set per status
Integration Email Notifications
By default email notifications are enabled. The SamurAI platform sends email notifications to registered users when an integration is reported as Critical e.g. the SamurAI platform has not receieved or ingested any data from the integrated product according to the defined threshold, however this is fully customizable.
Email notifications can be set per Product (e.g for all Palo Alto NG Firewalls) and/or per Integration (e.g for a single Palo Alto NG Firewall). Registered users can also customize what email notifications they receive. Refer to User Notifications Settings.
Enable or disable email notification per Product
- Click on more options () to the right of the table
- Select Notifications Per Product
- Toggle the setting to enable or disable by selecting the bell icon. Alternatively you can select the default setting
- Click Save
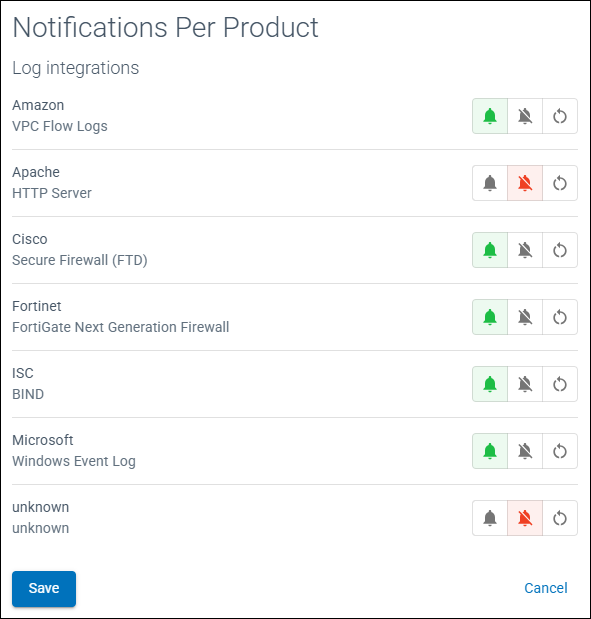
Figure 6: Example notification settings
Enable or disable email notification per Integration
- Click on more options () to the left of the integration
- Select Notifications
- A Notifications Settings window will be displayed
- Toggle the setting to enable or disable by selecting the bell icon. Alternatively you can select the default setting
- Click Save
Hide Integration
Hiding an integration will remove it from the integrations displayed and also from the Telemetry Monitoring view and disable notifications.
Only integrations of type Log can be hidden. Some reasons why you may want to hide an integration include:
- You may want to hide all of your unsupported/generic log source integrations.
- And you do not want to receive notifications if there is an issue with telemetry ingestion to the SamurAI platform.
To hide an integration:
- Find the relevant Log integration within the table
- Click on more options () select Hide integration
- A Hide Log Integration window will be displayed, click Confirm
To view any hidden integrations:
- Click on more options () at the top right of the table and select Hidden log integrations
- A Hidden Log Integrations window will be displayed with hidden integrations
Unhide Integration
- Click more options () at the top right of the table and select Hidden log integrations
- A Hidden Log Integrations window will be displayed
- Find the relevant Hidden integration
- Click on more options () to the left of the integration and select Unhide integration