Select the action you wish to take and jump to the relevant section:
- Create Integration
- View Integrations
- View Integration Details
- Integration Status
- Hide Integration
- Delete Integration
Create Integration
- From your SamurAI MDR portal tenant click Telemetry and select Integrations from the main menu.
- Click Create integration.
- Select the product you wish to integrate with the SamurAI platform.
- Click Next. Dependent on how we collect telemetry, the product may be integrated via a Cloud Collector or Local Collector. Follow the steps based on the Collector type:
Cloud Collector
- If the integration is cloud-based you need to select the relevant Cloud Collector. Select the relevant Cloud Collector and click Next.
- If you are using a public cloud storage account you should already have completed the steps in Cloud Collector.
- If no cloud storage is utilized then a default cloud collector is available.
- Select Configuration Guide which will direct you to SamurAI documentation outlining how to configure your product and obtain required fields.
- Once you have configured your product, complete the required fields.
- Select Finish.
Local Collector
- Your Local Collector(s) will be listed. Select the Local Collector that you will integrate the product with.
- Click Next (typically this is the syslog destination host when configuring your device). If you do not have a Local Collector setup and deployed, follow the steps in our SamurAI Local Collector article.
- The Local Collector IP Address will be displayed, copy the IP address or take note of it.
- Click Configuration Guide which will direct you to SamurAI documentation outlining how to configure your product.
- Based on the product, Extended Data Collection may be displayed, if so jump to Extended Data Collection.
- Click Finish
Extended Data Collection
For many products we are able to collect extended data enhancing our threat detection capabilities and accuracy, for example Packet Capture (PCAP) data. This option will be displayed during configuration of an integration.
- If extended data collection is available for the product, you can choose to enable or disable via the toggle. If you choose to disable, Select Finish
- If you choose to enable extended data collection you must complete all the necessary fields. The parameters for each field are derived from following the associated product configuration guide. Once complete, Select Finish
View Integration
There are multiple methods of viewing your integrations.
If you wish to view integrations associated with a specific collector:
- From your SamurAI MDR portal tenant click Telemetry and select Collectors from the main menu
- Select the relevant Collector
- All integrations associated with the Collector will be displayed with associated information
You can also view all integrations regardless of collector:
- Click Telemetry and select Integrations in the main menu
- All of your Integrations will be listed
What are the Integration fields?
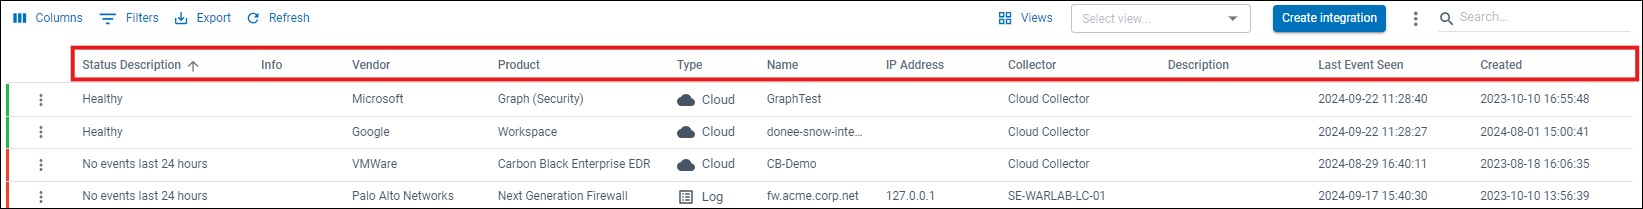
Status: Color indication of integration status
Status Description: Description of the status
Info: An info icon (
 ) will be displayed if:
- the integration is unsupported (unknown Vendor and Product)
- the integration does not send enough events to trigger a telemetry monitoring notification. Refer to Telemetry Monitoring for additional information
ID: Universally Unique Identifier (UUID) for integration
Vendor: Vendor name of the product
Product: Product name
Type: Integration type used to gather or ingest telemetry. Potential entries you could see here include:
- Log: Displayed when a telemetry source sends logs (typically via syslog) to a local collector or when ingesting logs through cloud storage e.g AWS S3 and/or Azure Blog storage
- Local: Displayed when we leverage an API from a SamurAI local collector to gather telemetry
- Cloud: Displayed when we leverage an API from a SamurAI cloud collector
Name: Integration name you provided during configuration
IP Address: IP address of the host
Collector: Collector name associated with the integration
Description: Optional description you provided during integration configuration
Last Event Seen: The last event seen from the telemetry source in the format [yyyy:mm:dd], [hh:mm:ss] with time represented in Universal Time Coordinated (UTC).
Created: Date and time of integration creation in the format[yyyy:mm:dd], [hh:mm:ss] with time represented in Universal Time Coordinated (UTC).
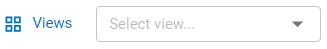
Views
You can save filters you set through views. This is useful if, for example, you have a large number of integrations and wish to view only specific products or types of integration.
Click Views to save/reset/delete your different filters. Once saved you can toggle between views.
View Integration Details
There are multiple methods of viewing your integration details. If you wish to view integration details associated with a specific Collector:
- From your SamurAI MDR portal click Telemetry and select Collectors from the main menu
- Select the relevant collector for your list
- All integrations associated with the collector will be displayed
- Find and click on your integrated product
You can also view all integration configuration regardless of collector:
- Click Telemetry and select Integrations from the main menu
- Find and click your integrated product
- Configuration parameters will be displayed
For integrations of type Log an events graph will be displayed. This is a useful indicator of the number of events over a given period and may show spikes and drops in events.
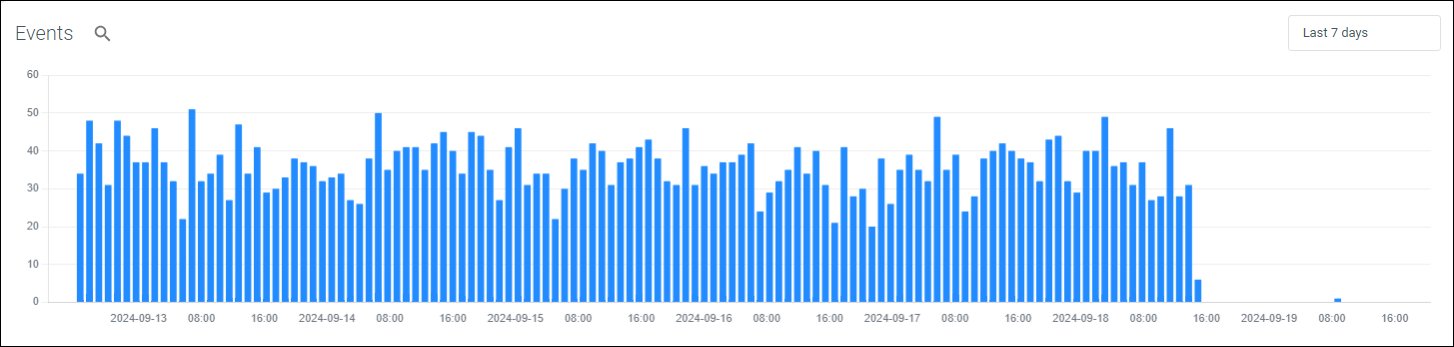
You can also pivot directly into Advanced Query by selecting the magnifying glass icon ( ) to view the underlying event data.
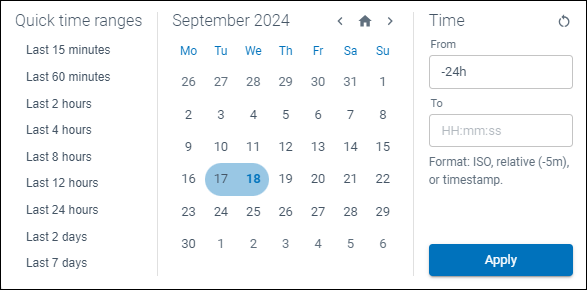
By clicking the time period you can update the events graph to a specific date and time range. We default to the Last 7 days however have included Quick time ranges or you can specify a date and time period.
View Integration Status
There are multiple methods of viewing your Integration status.
If you wish to view integration status associated with a specific Collector:
- From the SamurAI MDR portal Telemetry and select Integrations from the main menu
- Select the relevant collector from your list
- All integrations listed related to the collector will be displayed with status color and description (if enabled)
You can also view status of all integrations regardless of collector:
- From your SamurAI MDR portal Telemetry and select Integrations from the main menu
- All integrations shall be displayed with a status color and description (if enabled)
Potential status displayed are included in the table below:
| Status | Description |
|---|---|
| Provisioning | Telemetry components installing / provisioning |
| Unknown | The SamurAI platform is unable to determine a status |
| Healthy | All components healthy |
| No events seen in last 12 | The SamurAI platform has not seen any events in the last 12 hours |
| No events in last 24 hours | The SamurAI platform has not seen any events in the last 24 hours - this typically triggers an email notification |
For more information about Integration status, please see the article on how to manage Integration Health.
Hide Integration
Hiding an integration will remove it from the integrations displayed and also from the Telemetry Monitoring view. Additionally if the integration is supported and the SamurAI platform ingests no events, you will not receive an email notification.
Only integrations of type Log can be hidden. Some reasons why you may want to hide an integration include:
- You may want to hide all of your unsupported/generic log source integrations, the SamurAI platform does monitor unsupported integrations for your convenience however does not notify you if events are not seen in 24 hours.
- You do not want to recieve any notifications if there is an issue with telemetry ingestion to the SamurAI platform.
To hide an integration:
- Click Telemetry and select Integrations from the main menu
- Find the relevant Log integration
- Click on
 (more options) within the integrations table and select Hide integration
 - A Hide Log Integration window will be displayed, click Confirm
To view any hidden integrations:
- Click Telemetry and select Integrations from the main menu
- Click (more options) at the top right of the window select Hidden log integrations
- A Hidden Log Integrations window will be displayed
Unhide Integration
- Click Telemetry and select Integrations from the main menu
- Click (more options) at the top right of the window select Hidden log integrations
- A Hidden Log Integrations window will be displayed
- Find the relevant hidden integration
- Click on (more options) within the integrations table and select Unhide integration
Delete Integration
If you wish to delete an integration associated with a specific Collector:
- From your SamurAI MDR portal Telemetry and select Collectors from the main menu
- Select the relevant collector from your list
- You will now see all integrations associated with the collector
- Select your integrations
- On the right hand side of the relevant integration, click on (more options) and select Delete Integration
- The following warning will appear: ‘Warning: This is a destructive action and cannot be reversed.’. To ensure you intended to delete the integration you will need to type in the highlighted ‘Integration’s Hostname’ and select Delete Integration
You can also delete from the Integrations menu item:
- Click Telemetry and select Integrations from the main menu
- Find and select your integrated product
- On the right hand side of the relevant integration, click on (more options) and select Delete Integration