In this article all elements of the Network Traffic Analyzer are outlined to help you understand the panels available.
List all NTAs
Login to the SamurAI Portal
Click Telemetry and select Network Traffic Analyzer from the main menu
A list of all NTAs will be displayed. Various fields are displayed based on information you included when creating the NTA.
Click on an entry to drill into an NTA’s details.
General
The General panel of an NTA provides an overview of the NTA and status.
| Field | Description |
|---|---|
| Status | Status of the NTA. See NTA status for list of potential statuses |
| Description | A decription field for your NTA. You can edit this field at any time |
| Location | Populated from Location specified during creation of the NTA |
| Hostname | Hostname specified during creation of the NTA |
| Size | The size selected during creation of the NTA |
NTA Status
| Indicator | Status | Description |
|---|---|---|
| Pending | NTA components installing / provisioning or awaiting status | |
| Unknown | The SamurAI platform is unable to determine a status | |
| OK | Healthy | |
| Warning | Warning status will be displayed if the NTA is experiencing any issues e.g components are experiencing problems | |
| Critical | Critical status will be displayed and an email notification will be sent to registered users if the SamurAI platform cannot communicate with the NTA |
Current Status
The Current Status widget provides a visual representation of the CPU, Memory and Disk usage of the NTA. Each metric is displayed as a half-donut chart, offering a quick visual snapshot of system load.
| Metric | Description |
|---|---|
| CPU Utilization | Displays the percentage utilization across all CPU cores. |
| Memory Utilization | Displays the percentage of system memory consumed. |
| Disk Utilization / | Represents the percentage of storage space used for the system disk. |
| Disk Utilization /srv | Represents the percentage of storage space used for the data disk. Monitoring this metric ensures sufficient space for data/memory cache |
This widget may also include status messages of individual components of the NTA, this will assist with identifing any problems and should be included if you submit a ticket with the SamurAI SOC.
NTA Email Notifications
The SamurAI platform will send email notifications to registered users should your NTA status change to Critical. Once any issues have been resolved, you will also be notified again when rectified. Users have the option to enable or disable notifications.
Enable or Disable Email Notifications
- From the NTA Table view, click on More Options (
 ) to the right of the NTA View
 - Select Notifications Settings
- Toggle the setting to enable or disable by selecting the relevant icon per listed NTA. Alternatively you can select the default setting (send notification).
- Click Save.
You can also achieve this per individual NTA by:
- From the NTA Table view, click on More Options () to the left of the NTA.
- Select Notifications
- Toggle the setting to enable or disable by selecting the relevant icon. Alternatively you can select the default setting (send notification).
- Click Save.
System Information
The System Informatiom panel displays important NTA system information and metrics including:
System
| Field | Description |
|---|---|
| Operating System | The NTA leverages Ubuntu, it is our repsonsibility to maintain the Operating System. |
| CPU | CPU information captured |
| Cores | No. of physical and logical cores of the NTA |
| Memory | Total memory of the NTA |
| Swap | Allocated disk space used as virtual memory |
Storage
| Field | Description |
|---|---|
| Mount | Directory where storage device or parition is attached to the file system |
| Device | Represents the virtual storage medium by path or Amazon EBS volume |
| Size | Capacity of storage device or partition |
| Usage | Amount of storage consumed in % |
Network Management
| Field | Description |
|---|---|
| Configuration | Static or DHCP |
| IPv4 | The assigned IP address. The Monitoring interface will not have an IP address |
| Proxy server | Proxy server configured during cofiguration creation |
| NTP servers | Network time protocol servers configured during configuration creation |
| Interface | Virtual adapter |
| Type | Management interface |
| MAC | Unique identifier assigned to the interface |
| Current Bandwidth | The data transfer rate of the network interface measured in Mbit/s |
Network Monitoring
| Field | Description |
|---|---|
| Interface | Virtual adapter |
| Type | Monitoring interface |
| MAC | Unique identifier assigned to the interface |
| Current Bandwidth | The data transfer rate of the network interface measured in Mbit/s |
Metrics
All metrics displayed are by default over the past 2 hours however you can adjust via the Time Picker
| Metric | Description |
|---|---|
| CPU Utilization | Displays the percentage utilization across all CPU cores. High usage may indicate heavy traffic analysis or potential system strain |
| Memory Utilization | Displays the percentage of system memory consumed. Persistent high usage could impact performance and may require optimization |
| Disk Utilization | Represents the percentage of storage space used across each disk mount. Monitoring this metric ensures sufficient space for traffic data and system operations |
| Bandwidth Utilization | Displays bandwidth utilization of the mirror interface in Mbit/s |
Alerts
The Alerts panel displays security detections made by the NTA.
You do not have to act on any alerts as the SamurAI SOC analysts triage, investigate and validate alerts as part of the Managed Detection & Response (MDR) service.
As alerts are validated by the SamurAI SOC analysts and investigated, they may potentially lead to a reported Security Incident and are marked accordingly. Our strategy includes visibility and transparency of the service we provide to you therefore this feature provides you that visibility showcasing the value of the NTA and service.
Alerts Summary
Alerts are summarized in a panel which can be updated based on a specified time period and includes:
- Security Incidents - the total number of security incidents reported to you that may correspond to one or more alerts.
- Alerts - the total number of alerts detected by the NTA.
- Real-time engine- the total number of alerts created by the NTA resident SamurAI real-time engine.
- Vendor - the total number of alerts created by the NTA resident Intrusion Detection System (IDS) - Suricata.
Filters
Various filters are available to determine the alerts to be displayed.
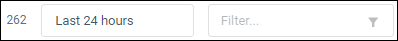
Figure 1: Time and Display filter
The total number of alerts within the alerts table in displayed to the left of the Time Period filter.
Time period
You can update all panels to specific date and time ranges. We default to the Last 24 hours however have included Quick time ranges.
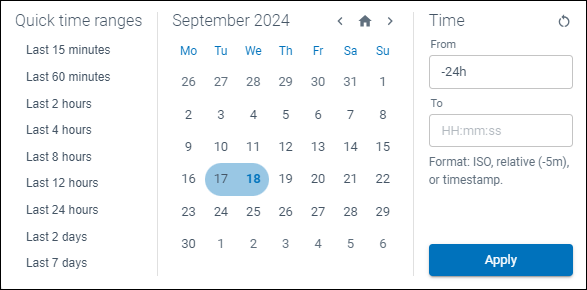
Figure 2: Date and time selection
Display Filter
Enter any values you wish to filter and highlight within the display filter.

Figure 3: Display filter
Alert Column Filter
Adjust and show/hide any of the column values within the Alert Table.
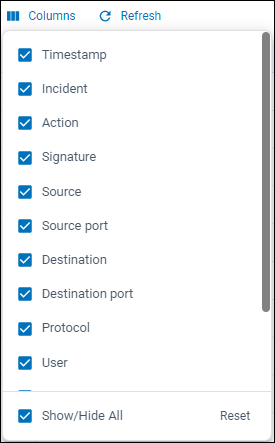
Figure 4: Alert column filter
Alerts Table
All alerts related to the NTA are listed within the alert table, it is important to note is that the table is limited to 10,000 alerts therefore apply filters to narrow the results.
For description of each field within the Alert table refer to Alerts Table